Candlestick patterns are repeated candle formations that traders use to read pressure, hesitation, rejection, and follow-through on a chart. A pattern name is not enough evidence by itself; the reading becomes useful only when candle anatomy, location, prior movement, rejection, and later response support the same interpretation.
What evidence is still needed?
| Trigger condition | Common misread | Evidence still needed | Safer interpretation |
|---|---|---|---|
| Long wick after a move into a level | The pattern already proves reversal | Whether price rejects the area and avoids acceptance beyond it | Treat it as a warning until later candles support the reading |
| Large body candle after a pause | The trend must continue | Whether the close holds and follow-through appears | Treat it as directional pressure, not completed proof |
| Doji after a sharp move | The market is reversing | Whether indecision turns into rejection, continuation, or absorption | Treat it as unresolved until the next response clarifies it |
| Engulfing-style response near a level | The signal is complete | Whether the level, participation, and later candles support the shift | Treat it as stronger only when the surrounding evidence points the same way |
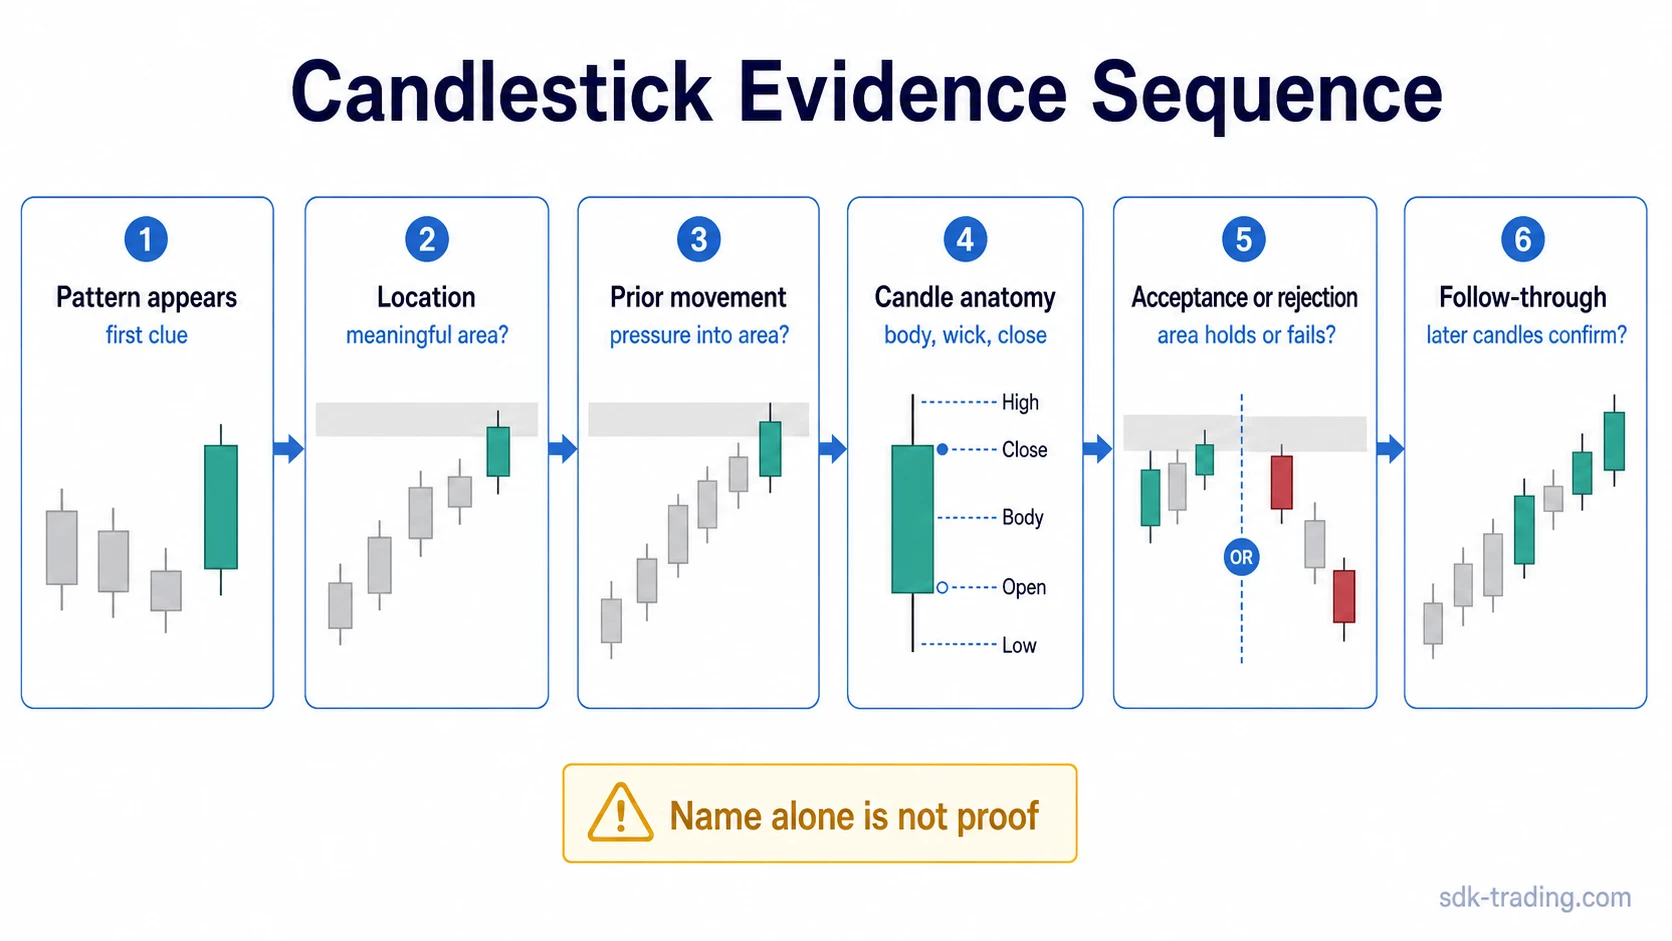
A pattern can warn that pressure may be changing, but it cannot prove a reversal, continuation, or failed move by itself. The same candle can carry different meaning near a meaningful level than it does in the middle of noisy movement. The safer reading starts with the pattern, then checks what the market does with the area afterward.
What a candlestick pattern can and cannot prove
A candlestick pattern is a repeated candle formation that reflects how price moved between the open, high, low, and close during one or more periods. Its value comes from the relationship between the candle shape and the surrounding market behavior, not from the label alone.
A strong candle body can show directional pressure during that period. A long wick can show rejection from one side of the range. A small body can show hesitation. None of these features proves what comes next. They describe what happened inside the candle and create a question for the next candles to answer.
The useful distinction is evidence versus interpretation. Evidence is the observable behavior: where the candle formed, how it closed, whether price accepted the area, and whether later candles supported or rejected the first clue. Interpretation is the conclusion drawn from that behavior. When the evidence is incomplete, the interpretation should stay conditional.
Candle anatomy that changes interpretation
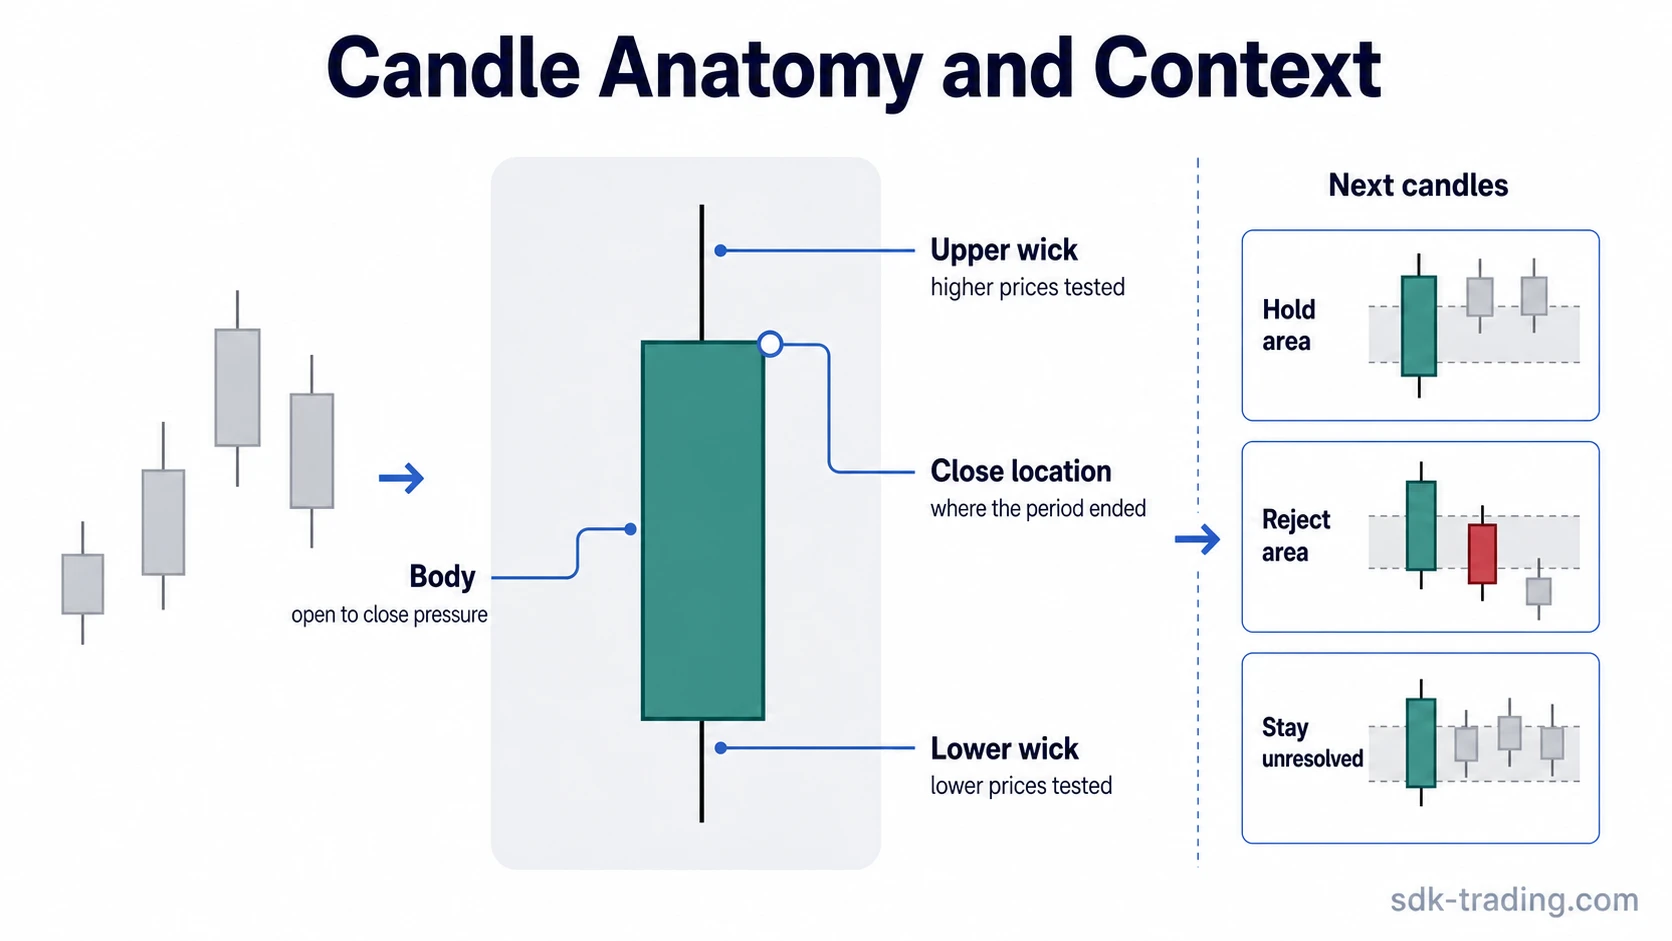
The body shows the distance between the open and close. A wide body can suggest stronger directional activity, but it still needs a location and follow-through. A wide bullish body after clear selling pressure may mean something different from the same candle appearing after an already extended advance.
The wick shows where price traveled but failed to hold. A long lower wick can suggest that lower prices were tested and rejected. A long upper wick can suggest that higher prices were tested and rejected. The wick matters more when it appears near an area where reaction is already plausible.
The close location often carries more weight than the high or low alone. A candle that briefly pushes above a level but closes back below it does not communicate the same thing as a candle that closes firmly above the area and holds later. The close shows where the period ended, while the next candles show whether that ending attracted acceptance or rejection.
Small-body candles require extra care. A doji candle can reflect hesitation, balance, or temporary absorption, but its meaning depends on what came before and how price responds afterward. After a sharp move, it may warn that momentum is slowing. Inside a range, it may add very little.
Why location and prior movement change the reading
A candle pattern near a prior reaction area carries a different evidence load than the same pattern in the middle of a range. Support, resistance, prior swing areas, range boundaries, and failed breakout zones can all show where acceptance or rejection matters. The level does not make the pattern correct, but it makes the next response more informative.
Prior movement also changes the meaning. A rejection candle after a clean decline into a support area can raise a different question than the same candle after sideways movement. A strong candle after a tight pause inside an existing move can suggest continuation pressure, while the same candle after exhaustion may be less reliable.
A hammer candle is a useful example. Its lower wick may show that price tested lower levels and recovered before the close. The reading is stronger when that recovery appears after prior weakness and near an area where demand could reasonably appear. It is weaker when the shape appears without a meaningful level, without a prior move, or without later support.
Pattern categories are background, not proof
Candlestick patterns are often grouped as single-candle, double-candle, triple-candle, and continuation formations. These groups help organize the visual structure, but they do not solve the interpretation problem.
Single-candle patterns depend heavily on location because one candle gives limited information. Double-candle and triple-candle patterns add sequence, but the sequence still needs acceptance, rejection, or follow-through. Continuation patterns are especially sensitive to prior trend quality because a pause inside strength is not the same as hesitation after exhaustion.
The category tells what kind of formation appeared. It does not determine whether the market has accepted, rejected, or ignored the area.
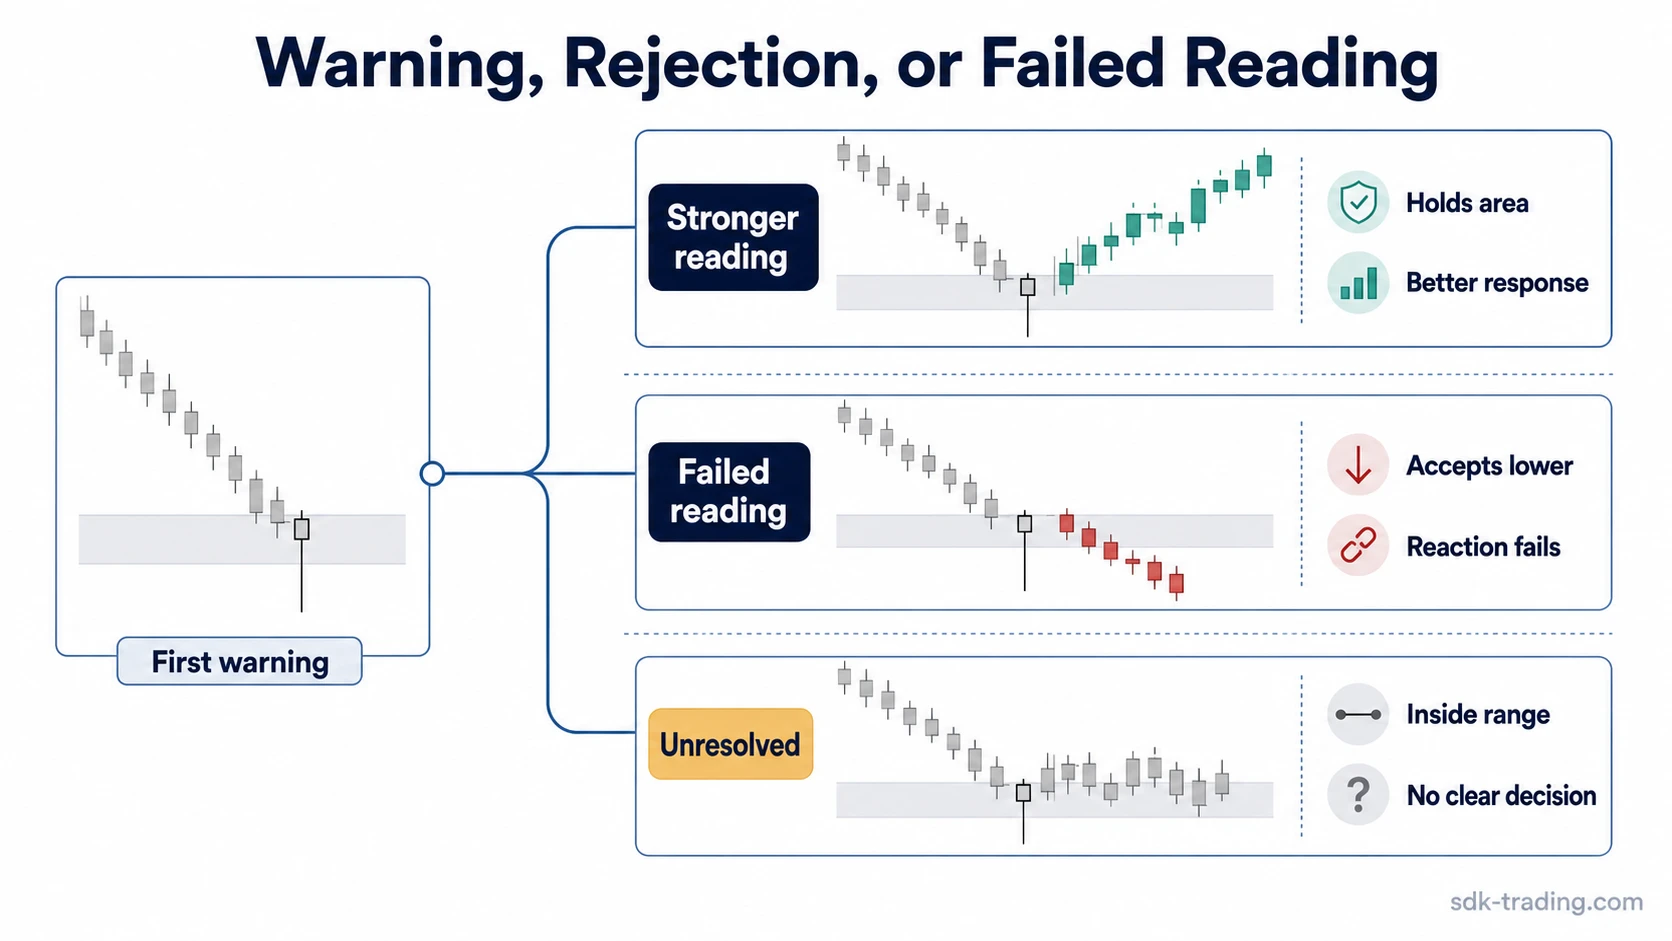
Practical scenario: warning, rejection, or failed reading
Consider a market that declines into a prior reaction area and prints a candle with a long lower wick. The first reading is only a warning that lower prices were tested and did not hold during that period.
The clue gains weight if later candles hold above the wick area, avoid acceptance below the level, and close with better upward response. The first candle was not proof by itself; it became useful because later behavior supported the same area.
The clue loses weight if price returns below the wick area and begins accepting lower prices. The long wick then marks a failed reaction rather than a useful reversal clue.
The clue remains unresolved if price stays inside the candle range without clear rejection or acceptance. The pattern warned that pressure might be changing, but the market did not yet provide enough behavior to support a stronger interpretation.
Misreads that weaken the evidence
The first weak reading is treating the name as the conclusion. A bullish or bearish label describes the visible formation, not the full market condition behind it.
The second weak reading is ignoring where the pattern appears. A rejection shape near a tested level can be meaningful. The same shape in the middle of uneven movement may be noise.
The third weak reading is confusing a wick with completed rejection. A wick shows that price moved away from an extreme before the close. Rejection becomes more defensible only when the market avoids acceptance beyond that area later.
The fourth weak reading is using timeframe as a shortcut. A pattern on a higher timeframe may attract more attention, but timeframe alone does not remove the need for location, prior movement, and later response.
The fifth weak reading is forcing every pattern into reversal language. Some formations show continuation pressure, some show hesitation, and some only show that the current reading is incomplete.
FAQ
What makes a candlestick pattern more reliable?
A pattern becomes more reliable when location, prior movement, candle anatomy, acceptance or rejection, and later follow-through support the same interpretation.
Why can the same candlestick pattern mean different things?
The same shape can appear after exhaustion, during a pause, near a reaction area, or inside random movement. The candle shape is the same, but the surrounding evidence changes the meaning.
When does a long wick become a rejection clue?
A long wick becomes a stronger rejection clue when it tests a meaningful area, closes away from the extreme, and later candles avoid accepting beyond that wick zone.
Should pattern names be learned before candle anatomy?
Pattern names are easier to use when candle anatomy is understood first. Body size, wick length, close location, and the relationship to the prior move explain why the pattern may or may not matter.
What does follow-through add to a candlestick reading?
Follow-through shows whether the market accepts, rejects, or ignores the candle area. Without that later response, the pattern remains an early observation rather than a completed interpretation.
The pattern is a clue, not the whole interpretation
Candlestick analysis works best when the candle is treated as one part of a larger evidence sequence. The pattern identifies a possible change in pressure. The surrounding structure decides whether that possible change deserves more weight.
A disciplined reading does not ask whether the pattern name sounds bullish or bearish. It asks where the pattern formed, what pressure came before it, how the candle closed, whether the market accepted or rejected the area, and what the next response supported or weakened.