The most common candlestick mistake is treating a recognizable candle shape as a complete signal. A candle records what happened during one period, but location, prior movement, timeframe, volume context, and later price response determine how much weight the shape deserves.
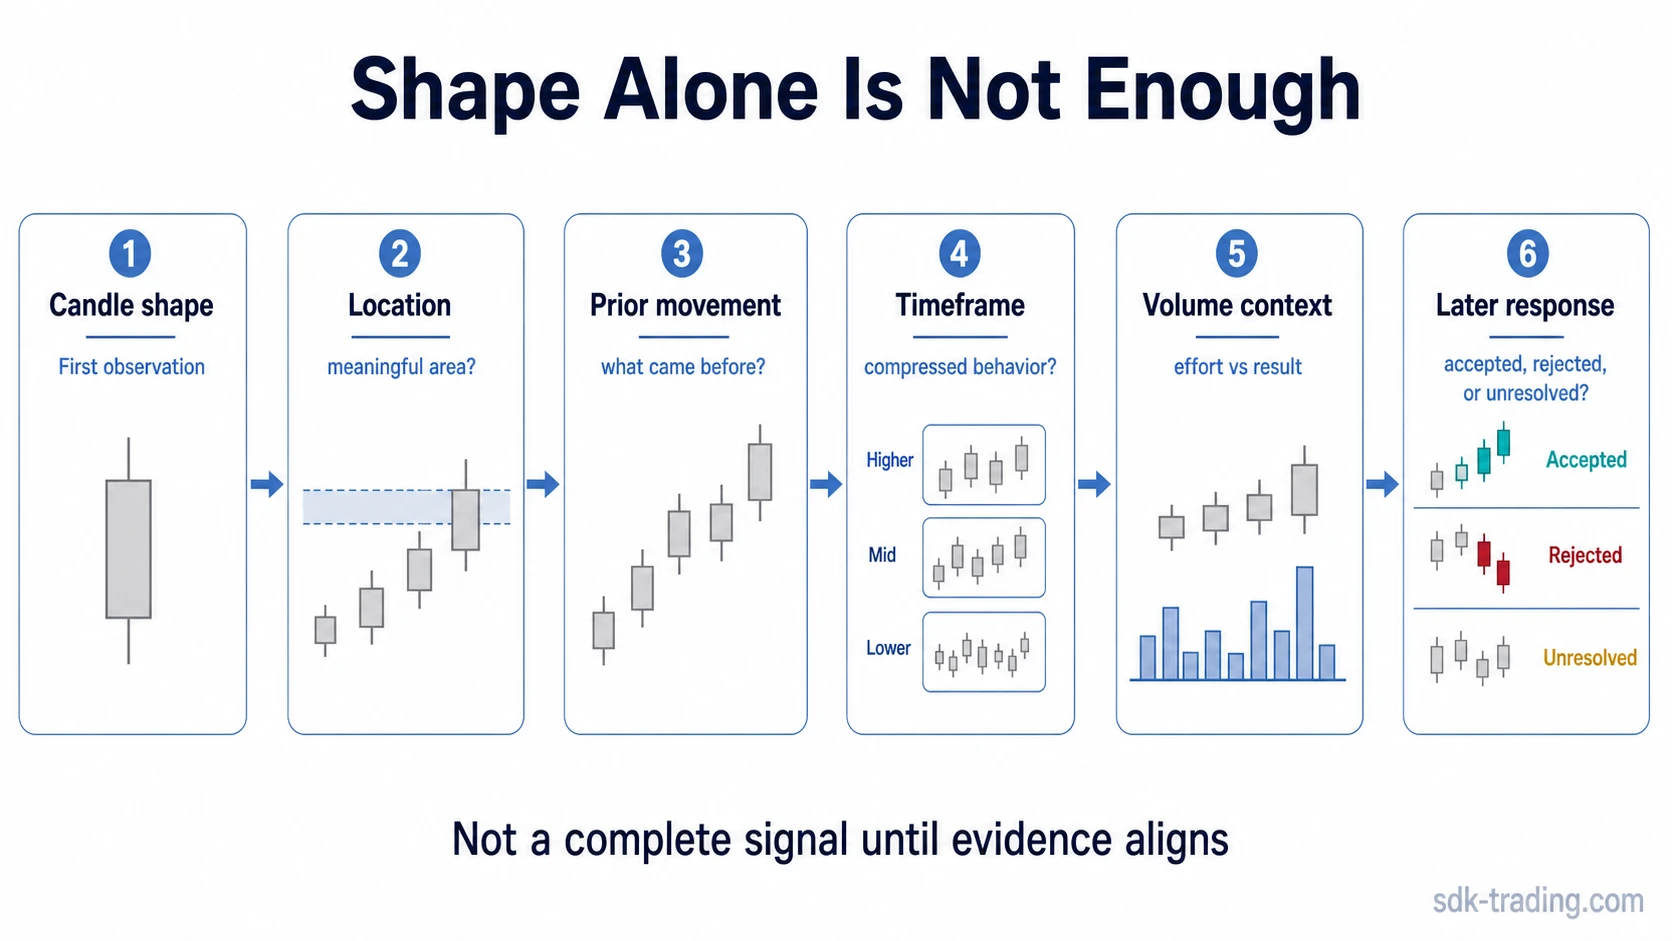
A hammer, doji, engulfing candle, long wick, or large body can be visually clear while the interpretation remains weak. The useful question is not only what the candle is called, but what happened before it, where it formed, and whether later price behavior supports the initial reading.
Key Points
- Candle shape describes behavior inside one period; it does not explain the full market context.
- The same candle can carry different weight depending on location and prior movement.
- Lower timeframes can reveal behavior hidden inside one larger candle, but more detail does not automatically mean more reliability.
- Volume can support an interpretation but should not replace price behavior.
- Later acceptance, rejection, or follow-through can strengthen or weaken the original candle reading.
See Why Candlesticks Need Context on a Real Chart
This section of the stock-chart walkthrough shows why candlesticks are better treated as context than as a standalone trading system. A candle can provide a useful clue, but the surrounding structure determines whether that clue deserves more weight.
The important distinction is between observing a candle and treating that candle as a conclusion. The candle can warn that local behavior changed, while location and later price action determine whether the warning becomes more meaningful.
Six Checks Before Interpreting a Candlestick
A candle becomes more useful when several independent pieces of context support the same interpretation. These checks should come before confidence in the pattern name.
| Check | What to Ask | Why It Matters |
|---|---|---|
| Candle shape | What do the body, wicks, open, close, high, and low actually show? | Defines the observation without assigning more meaning than the candle contains. |
| Location | Did the candle form near a meaningful reaction area or in the middle of ordinary overlap? | The same shape can carry different weight depending on where it appears. |
| Prior movement | Was price trending, declining, extending, consolidating, or already moving sideways before the candle? | A reversal-looking candle needs something meaningful to reverse. |
| Timeframe | What behavior has been compressed into this candle? | One daily candle can contain several smaller attempts, recoveries, and failures. |
| Volume context | Did increased or reduced activity produce a meaningful price result? | Volume can add evidence, but activity alone does not establish the interpretation. |
| Later response | Did subsequent candles accept, reject, or fail to follow through on the initial clue? | Later behavior shows whether the original candle gained or lost practical weight. |
Common Candlestick Mistakes
| Common Mistake | Why It Weakens the Reading | Better Check |
|---|---|---|
| Naming every recognizable shape | A candle can resemble a textbook pattern without creating a useful interpretation. | Keep the candle as an observation when the surrounding evidence is unclear. |
| Ignoring location | A candle near an important reaction area is different from the same candle inside random overlap. | Ask whether the market is testing a structurally meaningful area. |
| Ignoring prior movement | A reversal shape after a strong directional move is different from the same shape inside a sideways range. | Read what happened immediately before the candle. |
| Reading candle color too literally | A green candle is not automatically strong and a red candle is not automatically weak. | Compare body placement, wick behavior, close location, and surrounding structure. |
| Treating a long wick as automatic reversal | A wick proves that price moved away from an extreme during that candle, not that a larger reversal has started. | Check the location and the next price response. |
| Treating a large candle as automatic continuation | A large body shows strong movement during one period but can also appear near exhaustion or failed breakouts. | Check whether price maintains acceptance beyond the area reached by the candle. |
| Treating high volume as confirmation | Higher activity can accompany acceptance, rejection, or unresolved two-sided trading. | Compare volume with the actual price result. |
| Ignoring later price behavior | The first candle can look convincing while the next sequence completely rejects the interpretation. | Watch for acceptance, rejection, follow-through, or failed follow-through. |
When a Candle Should Stay Unnamed
Not every candle needs a textbook label. Leaving a candle unnamed can be more precise when the body is small, the wicks are balanced, the close is near the middle of the range, or the candle appears inside heavy overlap.
In those situations, the useful observation may simply be that pressure is mixed or unresolved. Forcing a pattern name can add confidence without adding evidence.
Safer naming rule: use a candlestick label when the visible shape is clear and the label helps describe the behavior. Use the surrounding chart, not the name itself, to decide how much that behavior matters.
How Later Price Response Changes the Reading
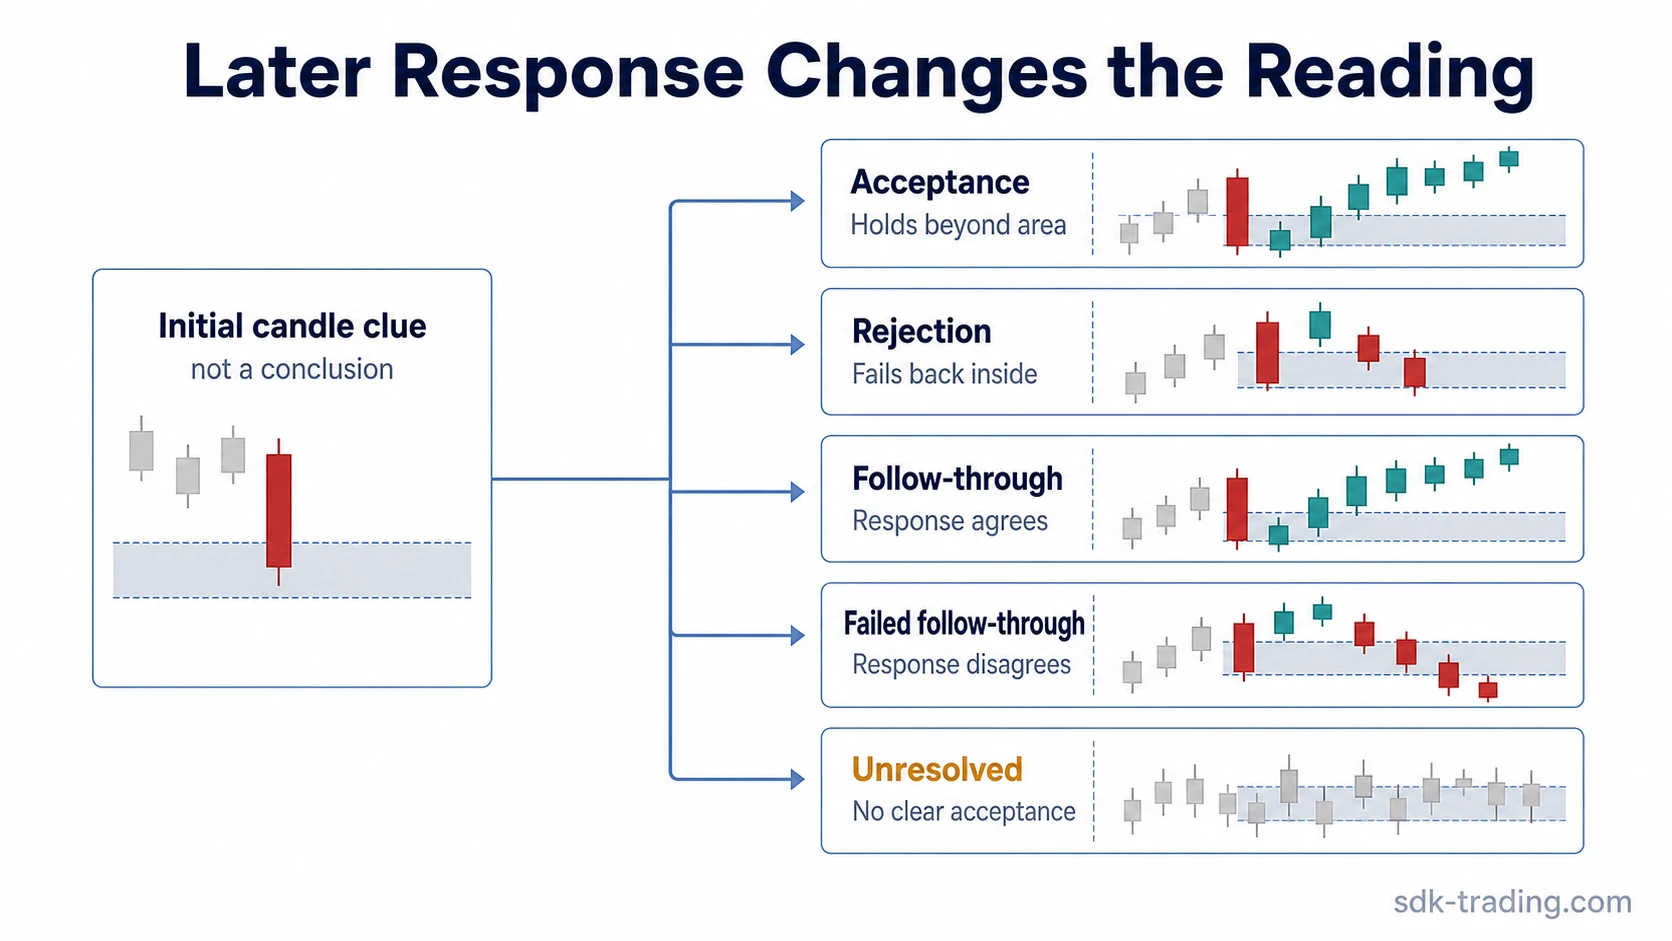
Later price behavior can strengthen, weaken, or leave the original candlestick clue unresolved. This is why two identical-looking candles can produce different interpretations once the next sequence develops.
| Later Response | What Happens | Effect on the Original Reading |
|---|---|---|
| Acceptance | Price holds beyond the area challenged by the candle. | The original reading gains support because later trading accepts the move. |
| Rejection | Price moves back through the area the candle appeared to defend or break. | The initial interpretation loses weight. |
| Follow-through | Later candles continue in a way that agrees with the original clue. | The candle becomes more useful as part of a developing sequence. |
| Failed follow-through | The expected continuation starts but cannot hold. | The original reading may have been premature. |
| Unresolved overlap | Later candles remain mixed and overlapping. | The candle remains an observation rather than a clear directional conclusion. |
Doji and Hammer: Two Common Context Mistakes
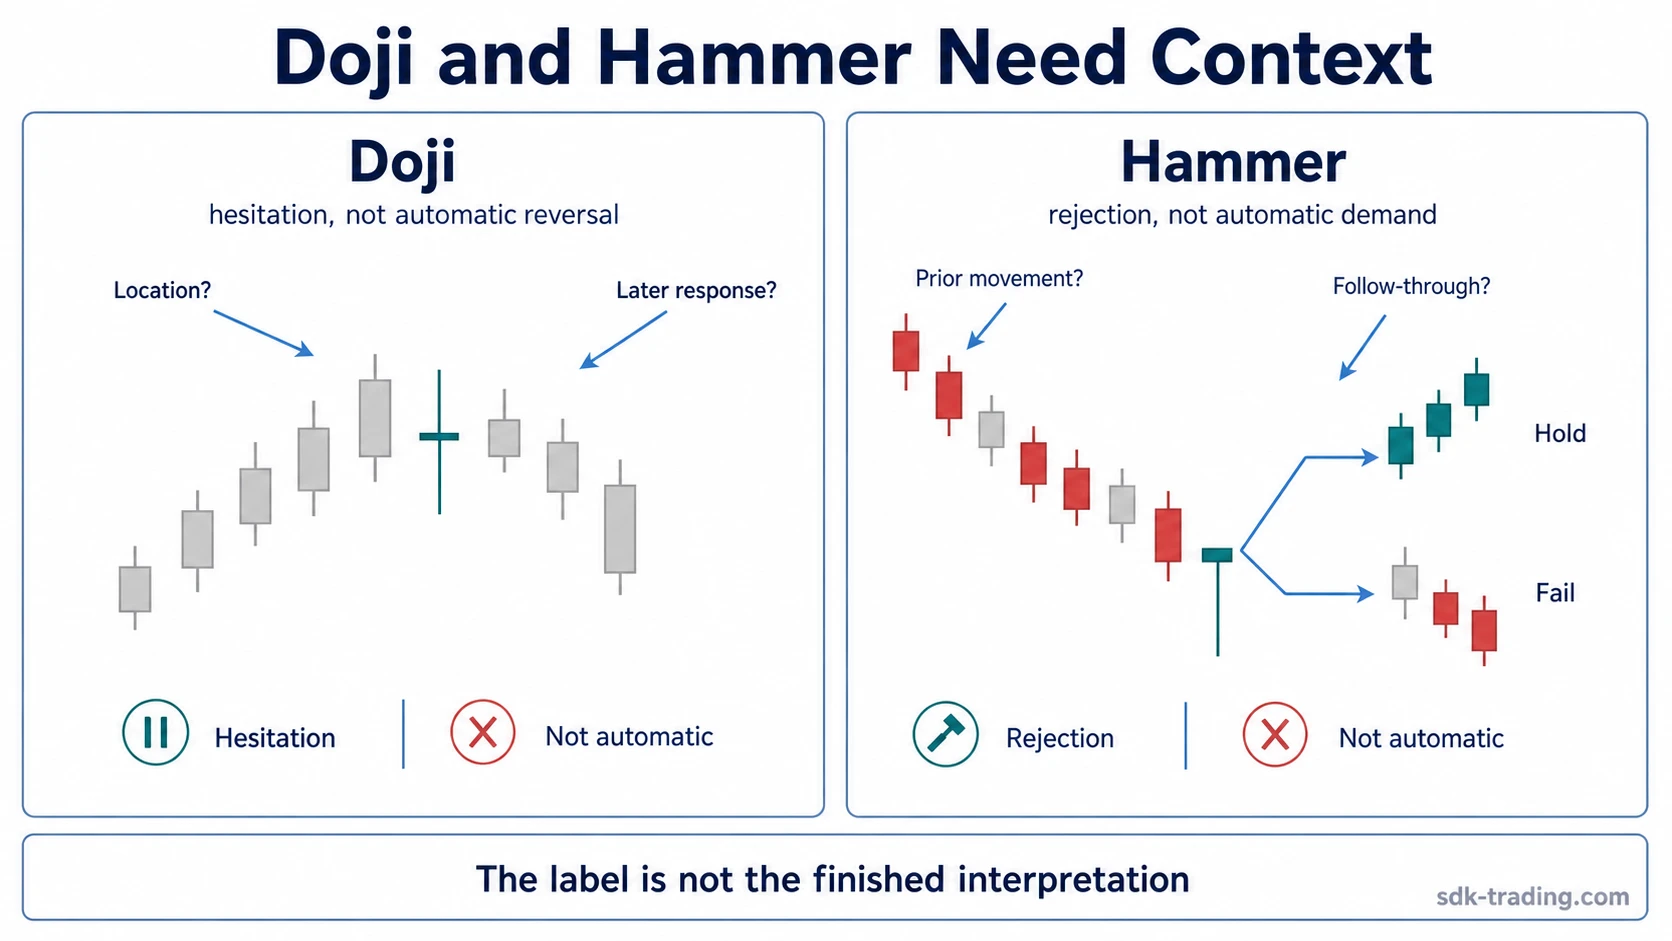
Doji and hammer candles illustrate the same broader problem in different ways. Their shapes can be easy to recognize, but the shapes do not determine the finished interpretation.
| Pattern | What the Shape Shows | Common Overread | What to Check Next |
|---|---|---|---|
| Doji | Open and close are close together relative to the candle range. | Assuming hesitation automatically means reversal. | Location, prior movement, and whether later price resolves the hesitation. |
| Hammer | Lower prices were rejected during the candle, leaving a long lower wick. | Assuming the wick automatically proves durable buying pressure. | Downtrend context, support location, close quality, and later follow-through. |
The Practical Boundary of Candlestick Reading
Candlesticks are useful because they compress price behavior into an easy visual form. They can reveal rejection, hesitation, expansion, compression, or changes in short-term pressure without requiring another indicator.
Their limitation is that one candle contains only one period of information. The candle becomes more meaningful when its shape agrees with location, prior movement, timeframe, and later price behavior.
The safest use is therefore contextual: recognize what the candle shows, then decide whether the surrounding chart gives that observation enough evidence to matter.