Popular candlestick patterns are widely recognized trading chart formations that many traders learn early because their shapes are easy to identify. Popularity reflects recognition and educational visibility; usefulness depends on whether the pattern helps classify rejection, indecision, continuation, exhaustion, or pressure shift at a meaningful chart location.
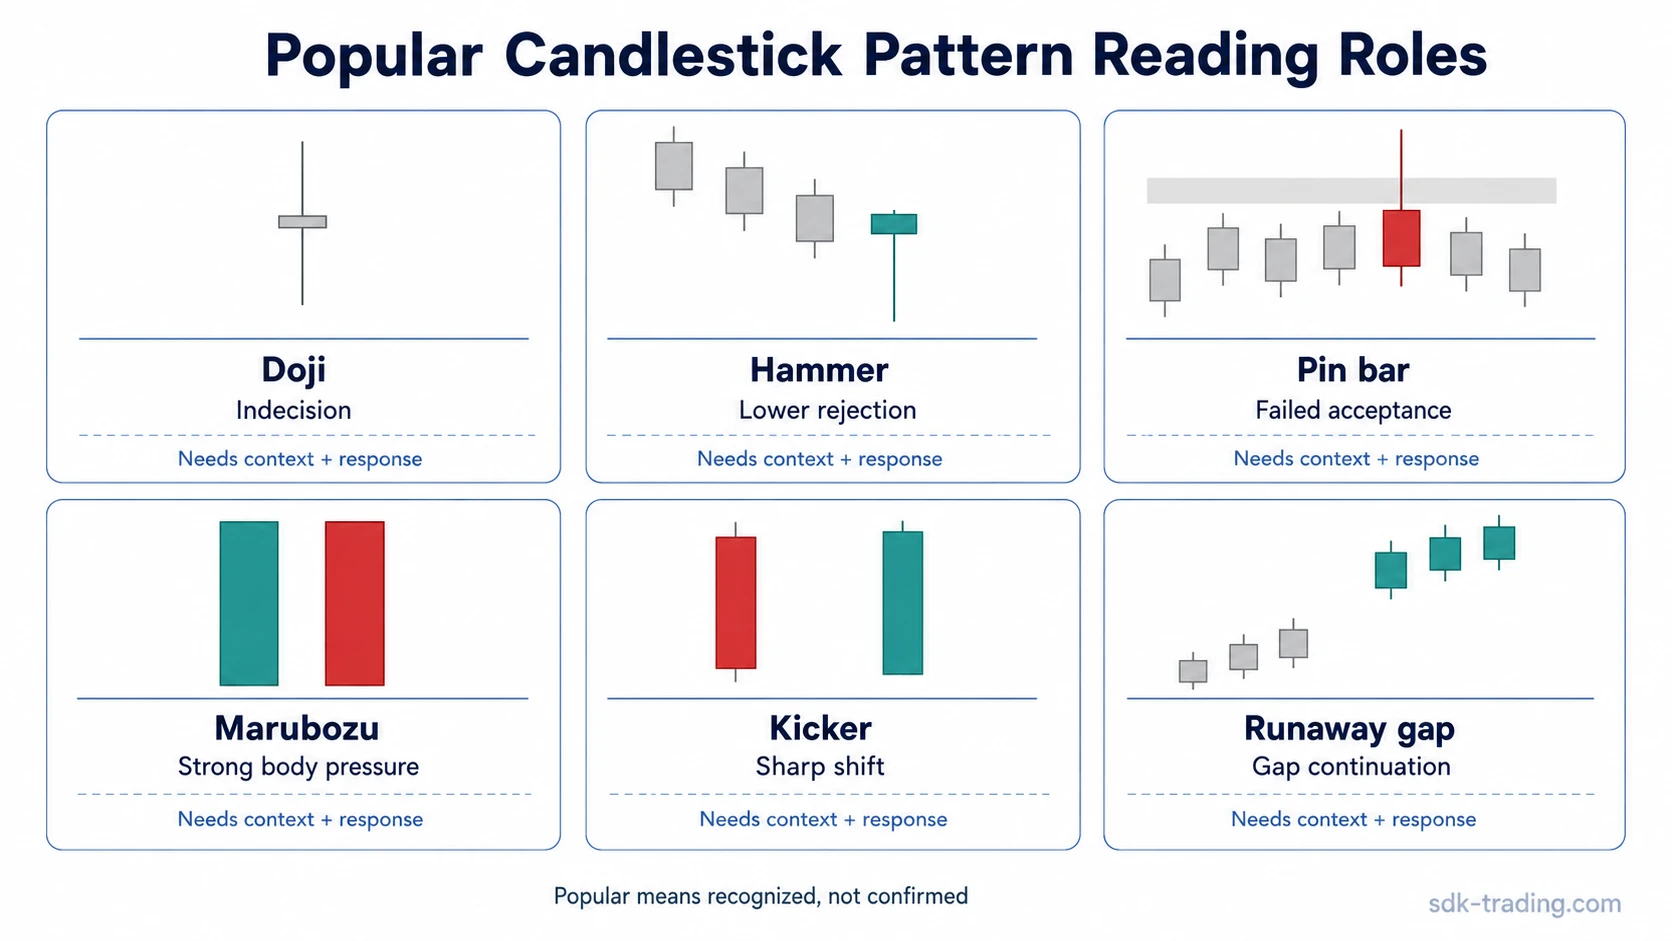
A stronger way to use the list is to group each pattern by the chart question it raises. A doji points toward indecision, hammer and pin bar candles point toward rejection, marubozu candles point toward strong body pressure, and gap-related patterns such as kicker and runaway gap candles point toward sharp shifts or continuation.
Key Points
- Popular candlestick patterns are widely recognized, not automatically more reliable.
- Grouping patterns by reading role is more practical than memorizing a ranked list.
- Doji, hammer, pin bar, marubozu, kicker, and runaway gap formations each raise different chart questions.
- Location, prior movement, volume context, and later price response decide whether the first candle clue remains useful.
What Makes a Candlestick Pattern Popular
A candlestick pattern usually becomes popular because it is visually simple, repeatedly taught, and easy to recognize on a chart. The most familiar patterns often have clear shape features: small bodies, long wicks, full bodies, gaps, or obvious contrast between candles.
That visibility can help with chart reading, but it can also create recognition bias. A familiar candle is only the first observation. The interpretation still depends on where the pattern appears, what happened before it, how the candle closed, and whether later price action accepts or rejects the area.
Popular does not mean reliable. A popular candlestick pattern is commonly recognized in trading education. A reliable reading requires stronger evidence from structure, location, volume, and follow-through.
Popular Candlestick Patterns by Reading Role
Popular patterns are easier to compare when they are grouped by the type of chart behavior they help observe. The same candle shape can mean different things in a trend, at a prior level, after a fast move, or inside a sideways range.
| Pattern group | What it helps observe | Pattern to study next |
|---|---|---|
| Indecision or equilibrium | A session where neither side creates a strong close away from the open. | Doji candles help frame uncertainty, balance, or hesitation before the next response clarifies direction. |
| Lower-wick rejection | A move below an area that fails to hold by the close. | Hammer candlesticks are often studied when traders want to understand demand-side rejection after downside pressure. |
| Wick-based rejection | A sharp probe that leaves a visible wick and closes back inside or near the prior area. | Pin bar patterns focus attention on failed acceptance after a wick probes beyond a level. |
| Strong body pressure | A candle where the body dominates the range and the close shows little hesitation. | Marubozu candles help study one-sided pressure, but later response still decides whether pressure continues or stalls. |
| Sharp sentiment shift | A sudden directional change where the market gaps or turns away from the prior candle structure. | Kicker patterns are used to study abrupt shifts in participation rather than slow balance changes. |
| Gap or momentum continuation | A move where price leaves a gap and does not immediately return to close it. | Runaway gap patterns help separate continuation pressure from gaps that quickly fail. |
Why Popular Patterns Are Easy to Misread
The main mistake is treating recognition as interpretation. A trader may see a familiar shape and give it meaning before checking whether the surrounding chart supports that meaning.
A doji after a calm sideways move does not carry the same weight as a doji after a fast advance into a prior resistance area. A hammer after a small pullback does not carry the same information as a hammer after a selloff that tests a known area and then rejects lower prices. The candle shape looks simple, but the reading comes from the sequence around it.
Common misread: the pattern name becomes the conclusion. A safer reading starts with the candle shape, then checks location, prior movement, volume context, and the next price response.
How to Choose What to Study Next
The most relevant pattern to study depends on the chart behavior being investigated. Hesitation, failed acceptance, one-sided pressure, sudden participation changes, and gap continuation require different visual clues.
Use the market question first and the pattern name second:
- For hesitation or lost directional clarity, start with doji behavior.
- For lower-price rejection, study hammer behavior and related lower-wick candles.
- For failed acceptance beyond a level, study pin bar behavior.
- For one-sided candle pressure, study marubozu behavior.
- For sudden participation shifts, study kicker behavior.
- For gap continuation versus exhaustion, study runaway gap behavior.
Popular vs Useful vs Reliable
Popular, useful, and reliable are different claims. A pattern can be popular because it is easy to name. It can be useful because it gives a clear first observation. It becomes more reliable only when the surrounding evidence supports the same interpretation.
| Term | Meaning in candlestick analysis | Main risk |
|---|---|---|
| Popular | Widely recognized and frequently taught. | Recognition may be mistaken for quality. |
| Useful | Helps organize a chart question quickly. | The first clue may be overread without structure. |
| Reliable | Supported by context, location, volume, and later response. | Reliability can be overstated without evidence. |
No candlestick pattern should be treated as a fixed ranking system. A less famous pattern in the right location can matter more than a famous pattern in the middle of noise. A highly recognizable candle can also fail quickly if the next candles reject its implied message.
Example of a Basic Popular Pattern Reading
Price advances into a prior resistance area and prints a small-bodied candle with long shadows on both sides. The doji shape makes hesitation visible, but it does not decide direction by itself.
The read becomes more useful if the next recovery attempt cannot reclaim the tested area and the market begins closing back below the prior range. The same doji remains unresolved if price continues to overlap around the level without acceptance or rejection. If buyers reclaim the area and hold it, the original hesitation warning weakens.
The name identifies the candle shape; the next candles show whether the market accepted, rejected, or ignored that clue.
FAQ
Are popular candlestick patterns more reliable?
No. Popularity means a pattern is widely recognized and often taught. Reliability depends on chart location, prior movement, volume context, and later price response.
Which candlestick pattern should beginners study first?
A doji is often a practical starting point because it teaches hesitation and balance. Hammer and pin bar patterns are useful next because they introduce rejection and failed acceptance.
Is there one best candlestick pattern for trading?
No single pattern is best in all conditions. A candle shape becomes more useful when it appears in a meaningful area and the following price action supports the same reading.