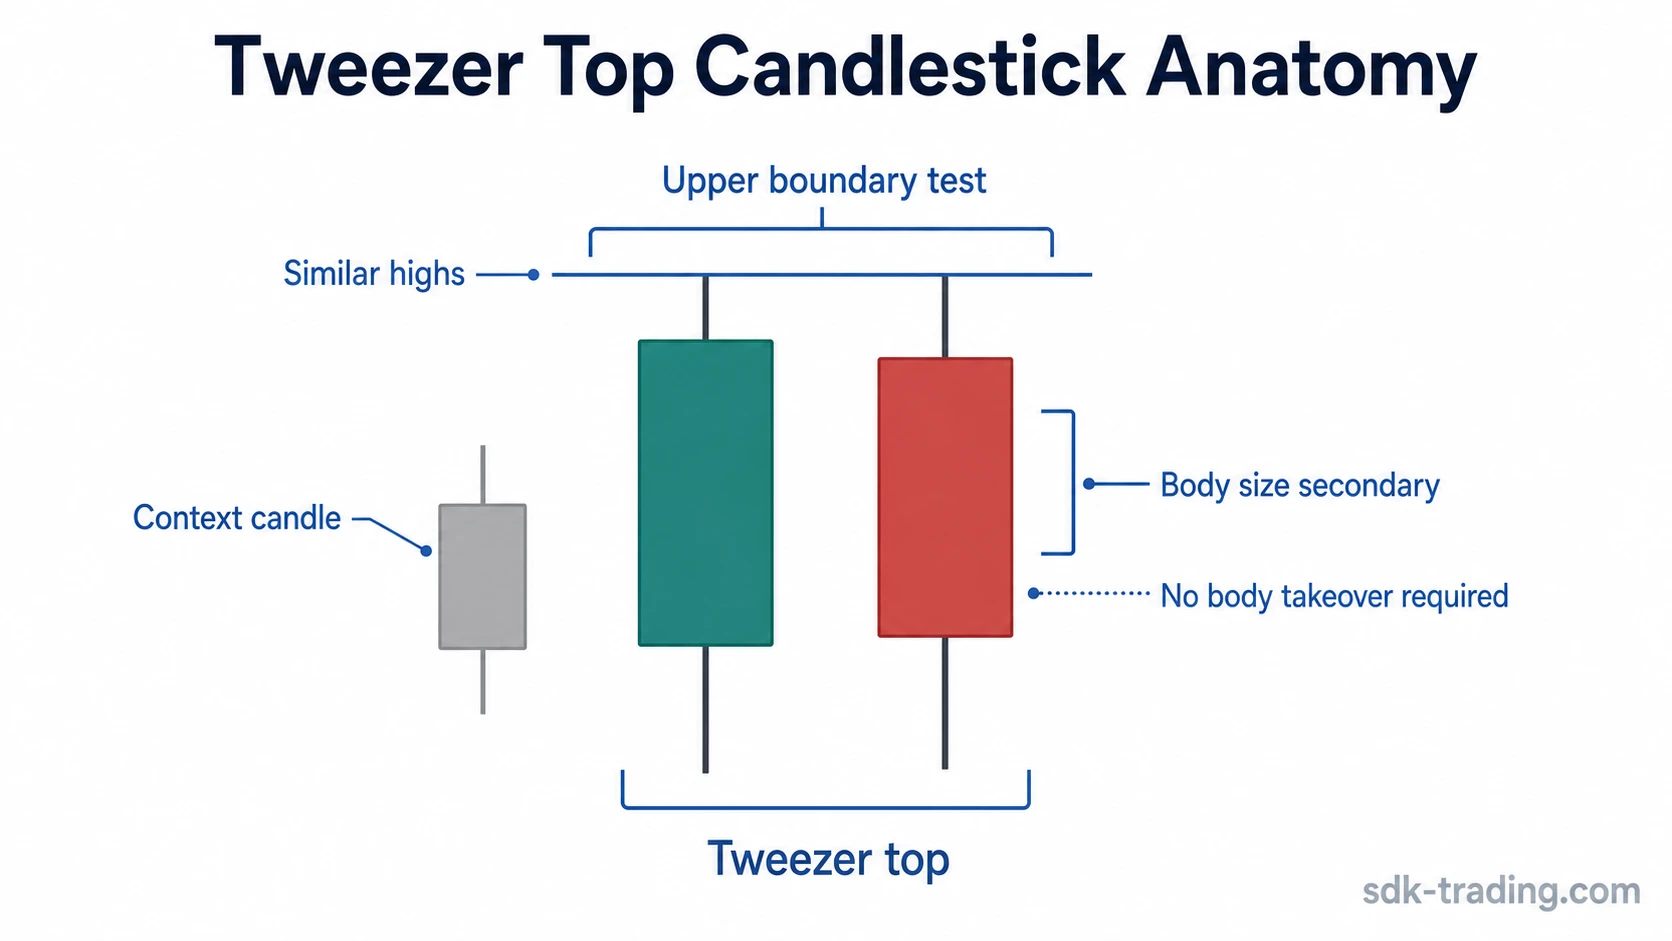
A tweezer top candlestick pattern is a two-candle trading structure where two nearby candles form similar highs at the same upper price area.
The pattern belongs to the double-candlestick family because the reading depends on the relationship between two candles, not on one candle alone. The central test is the repeated high. Body color, body size, and candle direction can add context, but they do not define the structure by themselves.
Definition: A tweezer top is a two-candle candlestick pattern in which the first and second candles reach nearly the same high, creating a visible upper boundary test after upward pressure or near a local resistance area.
Key Points
- A tweezer top is defined by similar highs across two nearby candles.
- The repeated high acts as the diagnostic boundary, not the candle body alone.
- The two candles do not need identical body color or equal body size.
- The structure weakens when price gains acceptance above the repeated-high area.
- Matching highs alone are not enough to create a complete bearish trading decision.
What Is a Tweezer Top Candlestick Pattern?
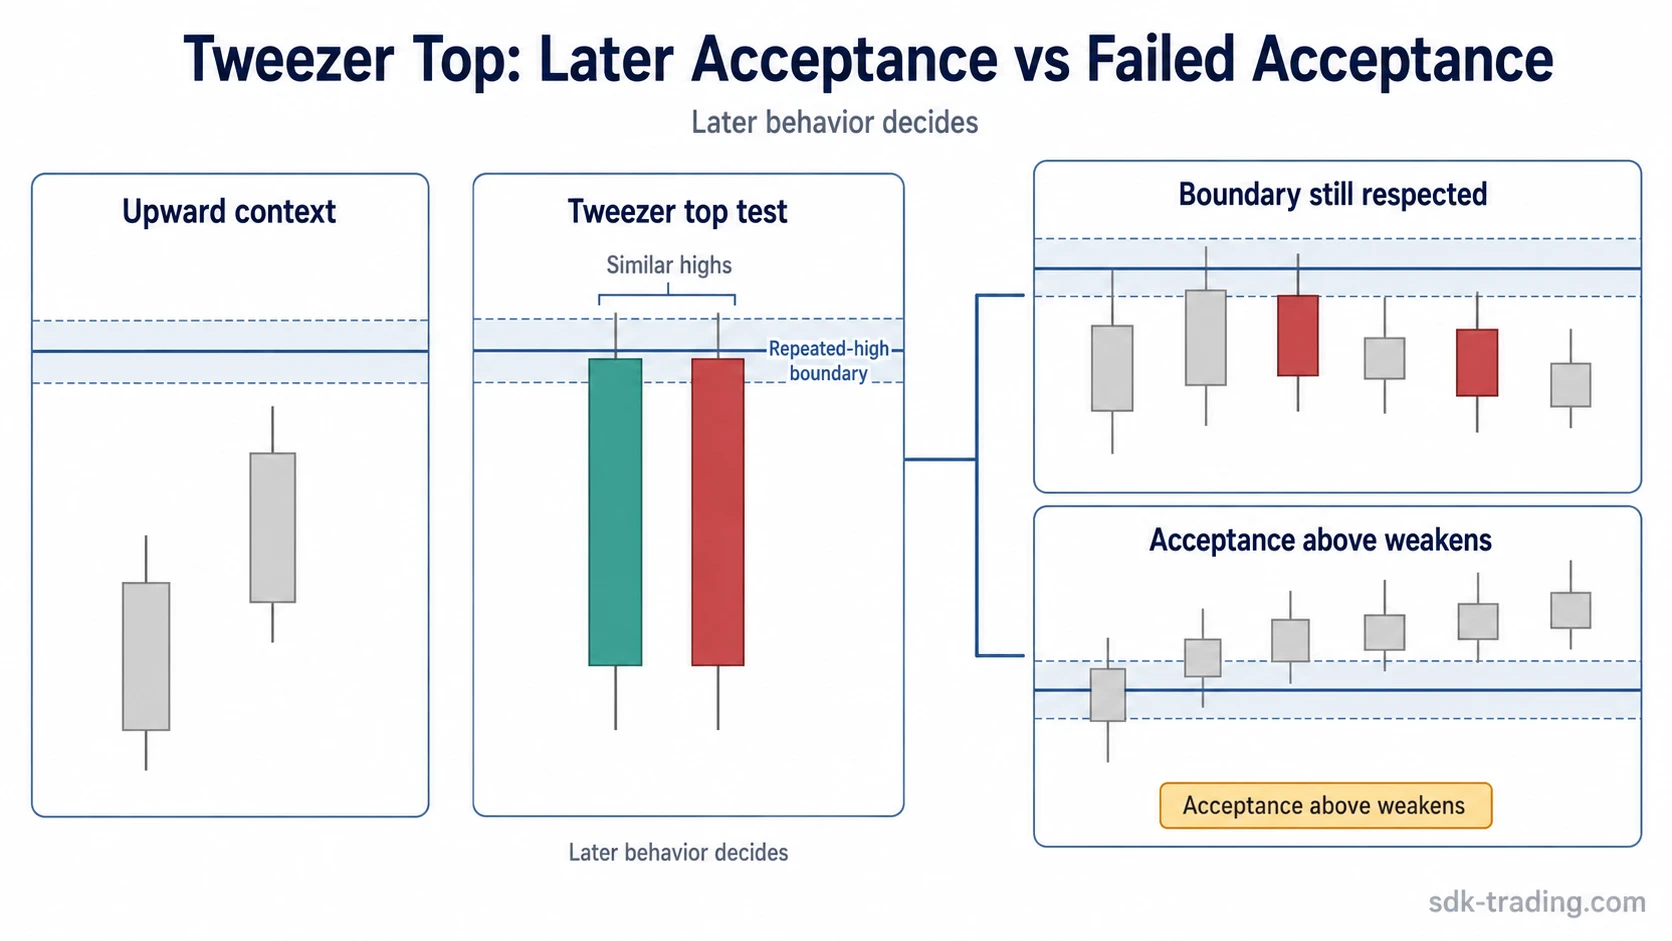
A tweezer top candlestick pattern marks a repeated test of an upper price boundary. The first candle reaches a high, and the next candle reaches a very similar high instead of clearly accepting above that area.
The structure is often discussed after upward pressure because the repeated high can show hesitation near the upper side of the recent move. That does not make the pattern a guaranteed reversal. It identifies a specific two-candle boundary test that needs surrounding structure and later behavior before the interpretation becomes more defensible.
The pattern is most useful as a diagnostic clue. Equal or nearly equal highs create the surface pattern, while the surrounding market structure determines whether that boundary has real meaning.
Matching Highs as the Upper Boundary
The tweezer top test starts with the high of the first candle. The second candle then reaches the same area or a very close area. A small difference between the two highs can still fit the structure when both candles clearly test the same upper boundary rather than accepting prices above it.
The real bodies do not need to match. A bullish candle followed by a bearish candle is common in textbook diagrams, but the repeated-high relationship matters more than a perfect body sequence. A candle pair can still form a tweezer top if the bodies differ, as long as the upper boundary test remains clear.
| Diagnostic element | What to check | Why it matters |
|---|---|---|
| Pattern family | Double-candlestick pattern | The reading depends on the relationship between two candles, not on one candle alone. |
| Number of candles | Two nearby candles | The structure depends on a paired high test. |
| High relationship | Same or nearly same high | This is the main tweezer top boundary. |
| Upper boundary | Both candles test the same visible area | The pattern becomes clearer when the highs align at a meaningful upper level. |
| Body relationship | No body takeover required | A tweezer top is not defined by engulfing the prior real body. |
| Body direction | Can differ between the two candles | Candle color can add context, but it does not replace the high test. |
| Body size | Secondary to the highs | Large or small bodies do not replace the repeated-high test. |
| Later behavior | Rejection or acceptance around the repeated high | Later candles decide whether the boundary remains relevant. |
A clean tweezer top interpretation becomes harder to defend when the second candle clearly extends above the first candle’s high and holds above that area. In that case, the market is not only testing the prior high; it is beginning to accept prices above the boundary that was expected to hold.
What Supports or Weakens a Tweezer Top Reading?
The pattern becomes more defensible when the upper area behaves like a real boundary. That can appear when the second candle tests the same high and fails to hold above it, or when later candles continue to reject that area instead of building acceptance beyond it.
The structure weakens when price trades above the upper boundary and stays there with follow-through. A brief wick above the first high is not always enough to invalidate the idea, but sustained acceptance above the area changes the interpretation. The market is no longer treating the repeated high as a clear upper boundary.
Limitation: Similar highs identify the tweezer top structure, but they do not complete the trading interpretation. The candle pair is only one piece of evidence. Location, prior pressure, later acceptance, and failed acceptance above the boundary all affect the reading.
A stronger interpretation usually comes from the relationship between the pattern and its surroundings. A repeated high in the middle of noisy price action carries less information than a repeated high at a clear upper boundary after a directional advance.
Repeated High Test That Fails to Accept Higher
A market advances into an upper boundary and prints a candle that reaches the area but closes below it. The next candle pushes into nearly the same high, then fails to hold above that zone. The two highs create the tweezer top structure because both candles tested the same upper area.
The important detail is not that the second candle automatically reverses the market. The useful detail is that price tested the same high twice and did not immediately build acceptance above it. If later candles reclaim that area and hold above it, the tweezer top interpretation becomes weaker.
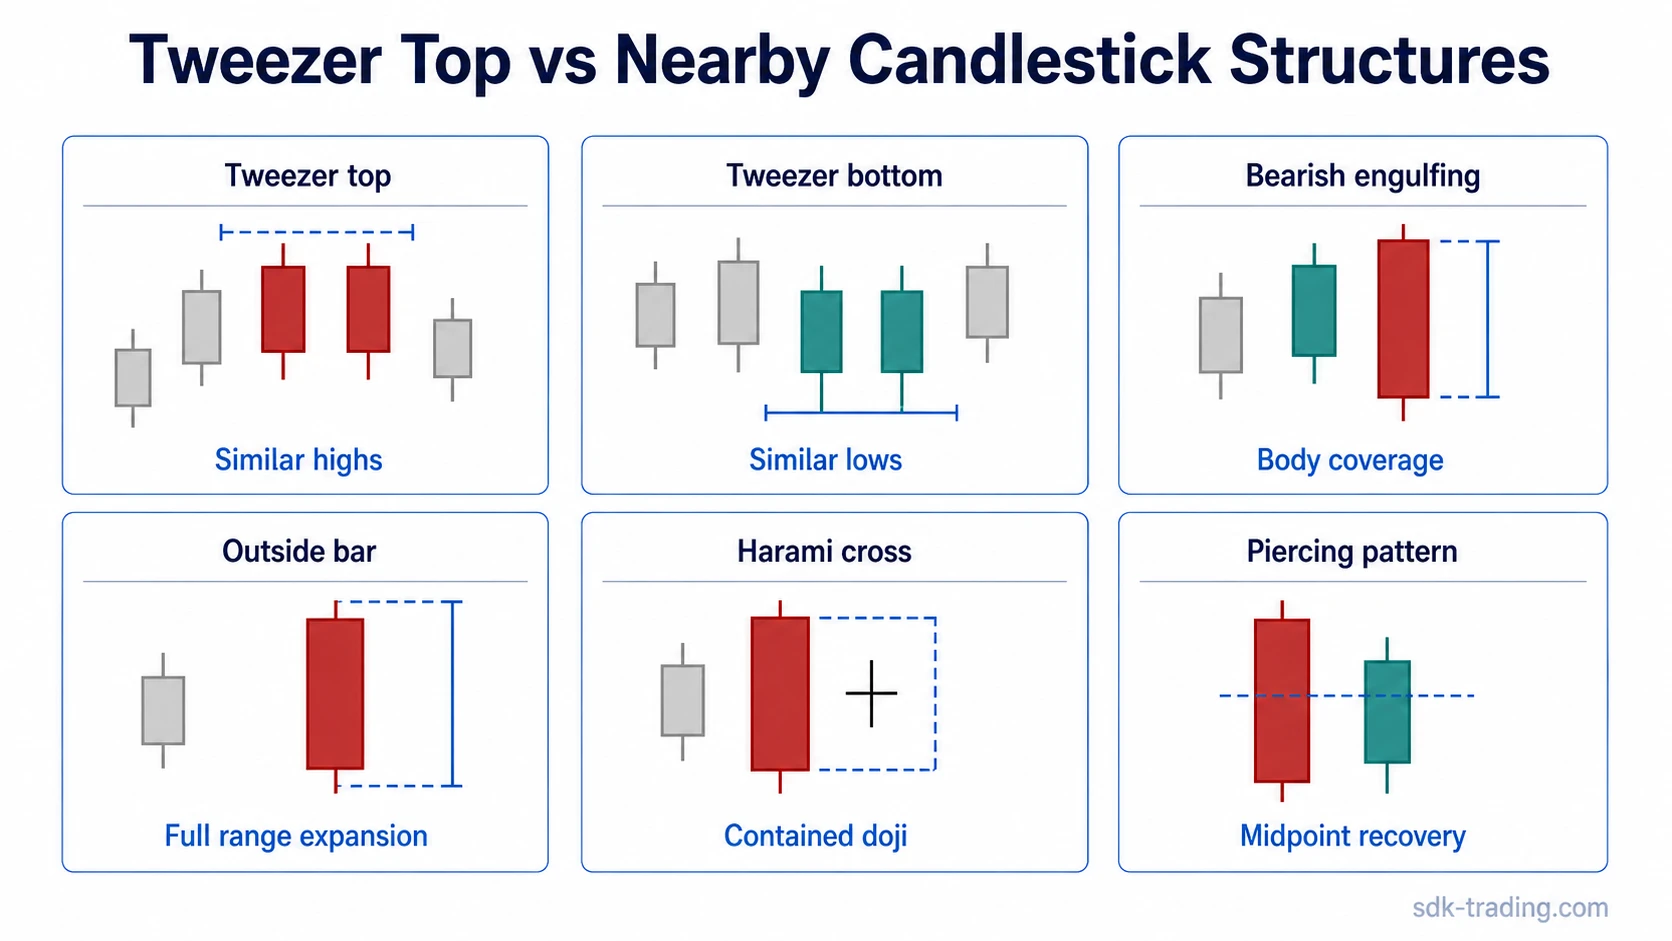
Tweezer Top vs Nearby Candlestick Patterns
A tweezer top is easy to confuse with nearby candlestick structures because several patterns can appear after upward pressure or around a local boundary. The difference is the structural test. Tweezer top focuses on similar highs. Other patterns use different diagnostic rules.
| Pattern | Main diagnostic test | Difference from tweezer top |
|---|---|---|
| Tweezer top | Two nearby candles form similar highs | The upper boundary is the defining feature. |
| Tweezer bottom | Two nearby candles form similar lows | It mirrors the structure at a lower boundary instead of an upper boundary. |
| Bearish engulfing | Second real body covers the prior real body | The body takeover matters more than matching highs. |
| Outside bar | Second candle expands beyond both the prior high and prior low | The full high-low range expands, rather than only matching an upper boundary. |
| Harami cross | Second candle is a doji or near-doji contained inside the prior real body | Containment and doji behavior matter more than repeated highs. |
| Piercing pattern | Bullish second candle recovers into the prior bearish real body | The midpoint recovery test is different from an upper-boundary equality test. |
Common Mistakes When Reading a Tweezer Top
The first mistake is treating any two similar highs as a complete bearish decision. The structure only says that price tested the same upper area twice. It does not say that sellers have full control or that the next move must reverse.
The second mistake is ignoring where the pattern appears. Similar highs at a visible upper boundary carry more diagnostic value than similar highs inside a flat, random range. The pattern is the surface clue; the surrounding structure gives that clue its context.
The third mistake is confusing a tweezer top with a body-engulfing pattern. A bearish engulfing pattern is judged mainly by the second candle’s real body covering the previous real body. A tweezer top is judged mainly by the equality or near-equality of the highs.
The fourth mistake is treating a small break above the first high and a clear acceptance above the first high as the same thing. A brief probe can still belong to a boundary test. A sustained hold above the area weakens the idea that the repeated high is acting as resistance.
FAQ
What makes a tweezer top different from two random candles with similar highs?
A tweezer top becomes more meaningful when the similar highs form a visible upper boundary test after upward pressure or near a local resistance area. Random similar highs inside noisy price action are weaker because the repeated-high area has less structural meaning.
Do both candles in a tweezer top need opposite colors?
No. Opposite candle colors can make the pattern easier to recognize, but the defining feature is the similar high. Body color and body size are secondary to the repeated upper-boundary test.
Does a tweezer top always mean a bearish reversal?
No. A tweezer top identifies a repeated high, not a guaranteed reversal. The reading depends on location, later rejection, failed acceptance above the repeated high, and the broader chart structure.
What weakens a tweezer top reading?
The reading weakens when price gains acceptance above the repeated-high area. If later candles hold above that boundary, the market is no longer respecting the level that defined the pattern.