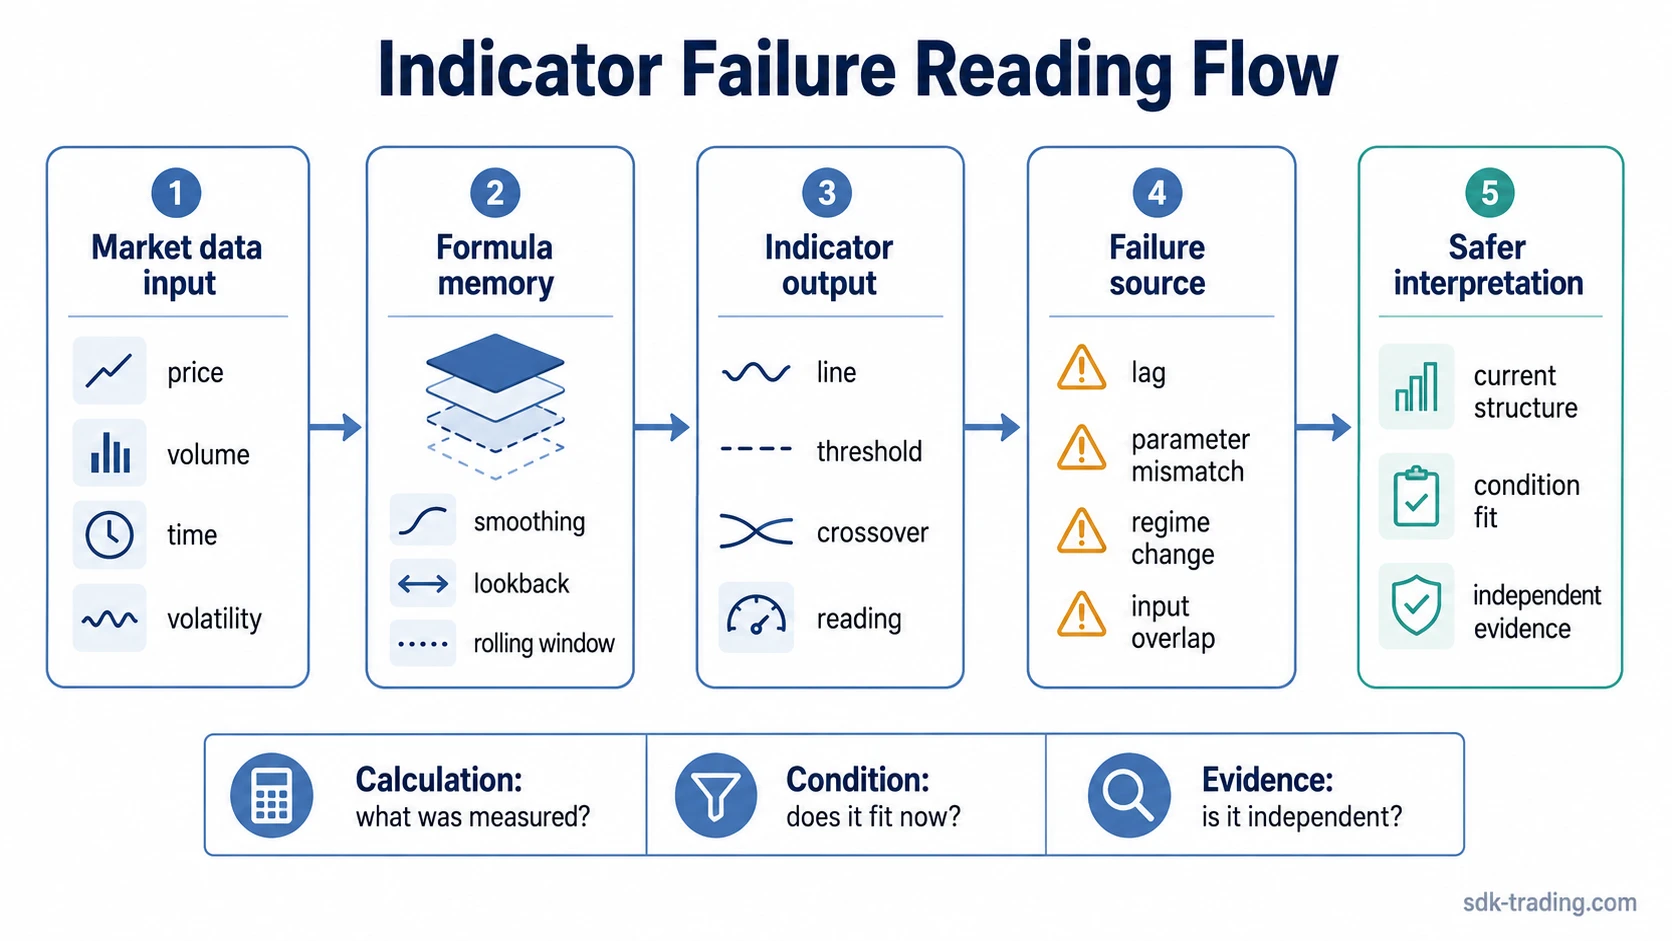
Indicators fail in trading when a formula built from prior market data is treated as fresh, independent evidence. The problem is usually not that the calculation is broken; it is that lag, rolling windows, thresholds, parameter settings, repeated inputs, or changing market conditions make the signal easier to overread.
Definition: Indicator failure happens when an indicator gives a technically valid output that does not match current market structure, volatility conditions, or the quality of participation behind the move.
A moving average can smooth price correctly and still react late. An oscillator can cross a threshold correctly and still describe a weak range-bound fluctuation. Several indicators can agree and still come from the same price input, which means the chart may look confirmed without adding independent information.
Key Points
- Most indicator failures come from mismatch: the calculation does not fit the current trading condition.
- Lag, smoothing, rolling windows, and parameter choices change what the indicator remembers.
- False signals can be formula-correct but structurally weak.
- Stacking similar indicators can repeat the same input instead of improving signal quality.
Why Indicators Fail Even When the Formula Is Correct
An indicator reduces market behavior into a defined calculation. That calculation may use price, volume, time, volatility, or a combination of inputs. The result can be precise inside its own formula while still being weak as a market interpretation.
The failure begins when the signal is read without asking what the calculation can and cannot see. A crossover, threshold break, or momentum shift can reflect completed price movement while the next part of the market is already changing character.
EMA smoothing is a simple example. The smoothing helps reduce noise, but it also delays the response because the line is still built from prior prices. That delay can be useful for structure, but misleading when the market has already shifted from trend into rotation or from compression into expansion.
The Main Reasons Indicator Signals Break Down
Indicator failure is easiest to diagnose by separating the calculation from the condition: what the formula measured, what price behavior is doing now, and whether the signal adds new evidence or repeats the same input.
| Failure source | What the indicator is doing | Common misread | Safer interpretation |
|---|---|---|---|
| Lag and smoothing | Compressing recent price behavior into a slower, cleaner line | Reading a delayed turn as a fresh signal | Treat the line as formula memory, then compare it with current price acceptance or rejection. |
| Rolling-window shift | Dropping older data and adding newer data as each bar completes | Assuming the indicator changed because market meaning changed | Check whether the shift came from the window calculation or from a real change in price behavior. |
| Threshold behavior | Marking a level such as overbought, oversold, expansion, or contraction | Treating the threshold as a direct trading instruction | Use the threshold as a condition label, then judge whether structure supports the interpretation. |
| Parameter sensitivity | Changing its memory length through lookback, smoothing, or sensitivity settings | Believing one setting reveals the true market state | Recognize that shorter settings react faster and longer settings filter more, but neither removes uncertainty. |
| Regime mismatch | Applying the same calculation during trend, range, compression, or repricing conditions | Expecting one indicator behavior to work across all environments | Match the measurement to the trading environment before treating it as useful evidence. |
| Redundant inputs | Repeating similar price-derived information through several indicators | Seeing agreement as independent support | Separate real evidence from input overlap before trusting the signal stack. |
| False positive | Producing a valid signal shape during weak or noisy price behavior | Calling the signal reliable because it matches the textbook condition | Look for whether price behavior around the signal shows strength, weakness, or unresolved balance. |
Why an Indicator Can Be Technically Correct but Structurally Weak
A false indicator signal does not always mean the indicator malfunctioned. The formula may have done exactly what it was designed to do, while the surrounding structure made the signal low quality.
Price moves sideways inside a tight range after a prior trend. A momentum oscillator flips above and below its midpoint several times as small candles alternate direction. The oscillator is responding correctly to each small change, but price still shows no clean acceptance outside the range. The signal is active, while the market structure remains unresolved.
The same problem can appear when volatility compresses. Small moves may trigger short-term line movement even though the broader market is still waiting for expansion. A calculation can describe the small movement accurately without saying much about the participation behind it.
Why Multiple Indicators Can Agree and Still Mislead
Indicator stacking becomes risky when several tools repeat the same input. A moving average, a momentum oscillator, and a trend filter may all react to the same recent price movement. The chart can appear to contain three separate signals while the underlying evidence is mostly one repeated data source.
Common mistake: Treating agreement between similar indicators as independent proof. Agreement is more useful when the tools measure different dimensions, such as trend strength, volatility, participation, or structure. If every tool is mainly rearranging the same recent price movement, the signal stack can create false confidence.
A cleaner diagnostic question is whether each tool adds a different measurement or simply echoes the same data. Redundant agreement can make a weak market look cleaner than it is.
Market Conditions That Increase False Signal Risk
Some environments make indicator failure more likely because the tool is forced to interpret behavior that does not match its strongest use case.
| Market condition | Why false signals increase | What to compare next |
|---|---|---|
| Range-bound price | Indicators flip repeatedly as price rotates between nearby boundaries. | Check whether price is being accepted outside the range or only probing it. |
| Low-volatility compression | Small price changes can create signal movement without meaningful expansion. | Compare the indicator move with volatility expansion and participation. |
| Sudden repricing or news-driven movement | Completed data may not reflect the speed of the current adjustment. | Separate delayed indicator response from the new price behavior. |
| Trend exhaustion | Trend-following indicators may still look strong after a mature portion of the move has already developed. | Compare the trend reading with loss of follow-through and failed continuation attempts. |
| Regime shift | A setting that worked in one environment may overreact or underreact in another. | Judge the condition first, then decide whether the indicator setting still fits the measurement job. |
An ADX trend-strength reading can help separate a cleaner directional environment from a weaker rotating one, but it still needs to be interpreted as a condition measure rather than a prediction tool.
How Parameter Settings Change Indicator Memory
Parameters decide how much market history an indicator uses. A short lookback reacts quickly but is more vulnerable to noise. A long lookback filters more noise but may respond after the current move is already mature.
The same indicator can look useful on one setting and unstable on another because the measurement window has changed. The formula has not discovered a hidden truth; it has changed what it remembers. The signal becomes more meaningful only when the chosen setting fits the condition being measured.
Safer interpretation: Treat parameter settings as measurement choices. A faster setting measures near-term sensitivity. A slower setting measures broader smoothing. Neither setting removes the need to compare the signal with current structure, volatility, and participation.
Backtest Strength Can Differ From Live Indicator Quality
An indicator can look stronger in historical testing than it feels during live interpretation. Historical charts make completed patterns easier to see, while live charts force decisions around incomplete candles, changing volatility, execution assumptions, and signal sequences that may still be unresolved.
The risk is not only curve-fitting. A rule can fit past conditions and still struggle when volatility, liquidity, trend persistence, or participation changes. Historical review is useful for studying behavior, but it does not prove that the next indicator signal will have the same quality.
How to Read Indicator Failure More Safely
A safer indicator interpretation starts with the question being measured. Trend strength, momentum, volatility, mean reversion, and smoothing are different jobs. A signal becomes easier to overread when the indicator is asked to answer a question it was not designed to measure.
Separate three layers before trusting the signal: the calculation, the environment, and the independence of the evidence. The calculation describes what the indicator measured. The environment decides whether that measurement is suitable. Independent evidence reduces the risk that several tools are only repeating the same input.
Clean reading: The indicator measures a condition that fits the current environment, and surrounding price behavior does not immediately contradict the signal.
Weak reading: The indicator triggers during range-bound, compressed, exhausted, or rapidly changing conditions where the formula is likely to lag or overreact.
Low-quality reading: The signal depends on redundant indicators, ignores the trading environment, or treats a formula threshold as a direct decision rule.
The goal is not to remove every indicator. The useful distinction is knowing what each indicator remembers, what it ignores, and when the trading condition makes its measurement less reliable.
FAQ
Why do trading indicators fail in ranging markets?
Trading indicators often fail in ranging markets because small rotations can trigger repeated signals without real directional acceptance. The formula may react correctly to each short movement, while price remains stuck inside a range.
Why do indicators look better in hindsight than live?
Completed charts remove uncertainty. Live interpretation must deal with incomplete candles, changing volatility, delayed calculations, and signals that may reverse before the market condition becomes clear.
Can multiple indicators agree and still be wrong?
Yes. Several indicators can agree because they are built from similar price inputs. Agreement becomes less useful when the tools repeat the same data instead of measuring different parts of market behavior.