Indicator divergence is easy to overread because disagreement between price swings and indicator swings does not confirm direction by itself. A divergence reading only says that price behavior and an indicator calculation are no longer moving in the same way.
Definition: Indicator divergence is a trading analysis condition where price makes a new swing high or swing low while an indicator, usually an oscillator or momentum-based tool, fails to make the matching high or low.
The interpretation depends on comparable pivots, indicator formula, smoothing or lag, and later price behavior. A weak mismatch can appear before structure changes, while a cleaner reading usually needs price swings and indicator swings that can be compared without forcing the pattern.
Key Points
- Indicator divergence compares price pivots against indicator pivots, not one candle against one indicator print.
- Regular divergence usually warns that the current price move is losing agreement with the indicator.
- Hidden divergence usually appears inside an existing trend or pullback structure, but it still needs context.
- False divergence often comes from poor swing matching, indicator lag, smoothing settings, or early reversal assumptions.
Misread vs Safer Interpretation
The common mistake is treating divergence as a finished reversal or continuation confirmation. A safer reading treats it as a mismatch that needs more structure before it carries weight.
| Observation | Common misread | Safer interpretation |
|---|---|---|
| Price makes a higher high while the indicator makes a lower high. | The uptrend must be ending. | Momentum may be fading, but the trend is not broken unless price structure also weakens. |
| Price makes a lower low while the indicator makes a higher low. | The market has confirmed a reversal. | Selling pressure may be losing force, but a reversal reading needs recovery, acceptance, or follow-through. |
| Different indicators disagree about whether divergence exists. | One indicator must be wrong. | Different formulas measure different states, so the reading should be tied to the indicator’s role. |
| Divergence remains visible for several swings. | The mismatch is becoming more reliable automatically. | Persistent divergence can simply mean the indicator is reacting to momentum loss while price structure has not changed yet. |
How Indicator Divergence Forms
Indicator divergence forms when comparable swing points move in opposite ways. The comparison should use similar pivot types: high against high, low against low, and indicator swing against the matching price swing.
A clean comparison does not require identical candle spacing, but the pivots should belong to the same market move. If price is compared across a major swing while the indicator is compared across a smaller pullback, the divergence can be manufactured by bad alignment.
| Price pivot | Indicator pivot | Possible divergence type | What still matters |
|---|---|---|---|
| Lower low | Higher low | Regular bullish divergence | Whether price later rejects the lower area and reclaims structure. |
| Higher high | Lower high | Regular bearish divergence | Whether buyers fail to hold the higher area or later demand weakens. |
| Higher low | Lower low | Hidden bullish divergence | Whether the pullback holds within a broader upward structure. |
| Lower high | Higher high | Hidden bearish divergence | Whether the recovery fails within a broader downward structure. |
Regular vs Hidden Indicator Divergence
Regular and hidden divergence describe different relationships between price structure and indicator output. Regular divergence usually focuses on possible exhaustion in the current move. Hidden divergence usually focuses on whether a pullback is still consistent with the existing structure.
| Divergence type | Price behavior | Indicator behavior | Interpretation boundary |
|---|---|---|---|
| Regular bullish | Price makes a lower low. | Indicator makes a higher low. | Possible downside exhaustion, not a confirmed bullish reversal. |
| Regular bearish | Price makes a higher high. | Indicator makes a lower high. | Possible upside exhaustion, not a confirmed bearish reversal. |
| Hidden bullish | Price makes a higher low. | Indicator makes a lower low. | Possible pullback continuation context, not automatic trend continuation. |
| Hidden bearish | Price makes a lower high. | Indicator makes a higher high. | Possible failed recovery context, not automatic downside continuation. |
Broader divergence in trading includes the same price-versus-tool disagreement, but indicator divergence adds a specific formula problem: the reading changes when the indicator calculation, smoothing, or pivot choice changes.
Why Indicators Show Divergence Differently
RSI, MACD, stochastic, CCI, Williams %R, and similar tools do not measure the same thing. Some react quickly to recent price movement, while others smooth the data or compare price to a range. The same chart can therefore show divergence clearly on one indicator and weakly on another.
| Indicator family | What can change the divergence reading | Common caution |
|---|---|---|
| RSI | Lookback length, overbought or oversold behavior, and how sharp the latest swing is. | RSI can show divergence while price structure still holds the prior trend. |
| MACD | Moving-average smoothing, histogram behavior, and signal-line lag. | MACD divergence may appear later than faster oscillators because smoothing delays the indicator response. |
| Stochastic | Range position, smoothing, and whether price is repeatedly pressing one side of the range. | Repeated extreme readings can persist during strong trends. |
| CCI / Williams %R | Range sensitivity, lookback period, and how far price moves from recent norms. | Fast changes can create noisy divergence if pivots are not matched carefully. |
RSI divergence needs its own treatment because RSI has specific range behavior, momentum compression, and overbought or oversold interpretation issues that do not transfer cleanly to every indicator.
Clean, Weak, and Invalid Indicator Divergence Readings
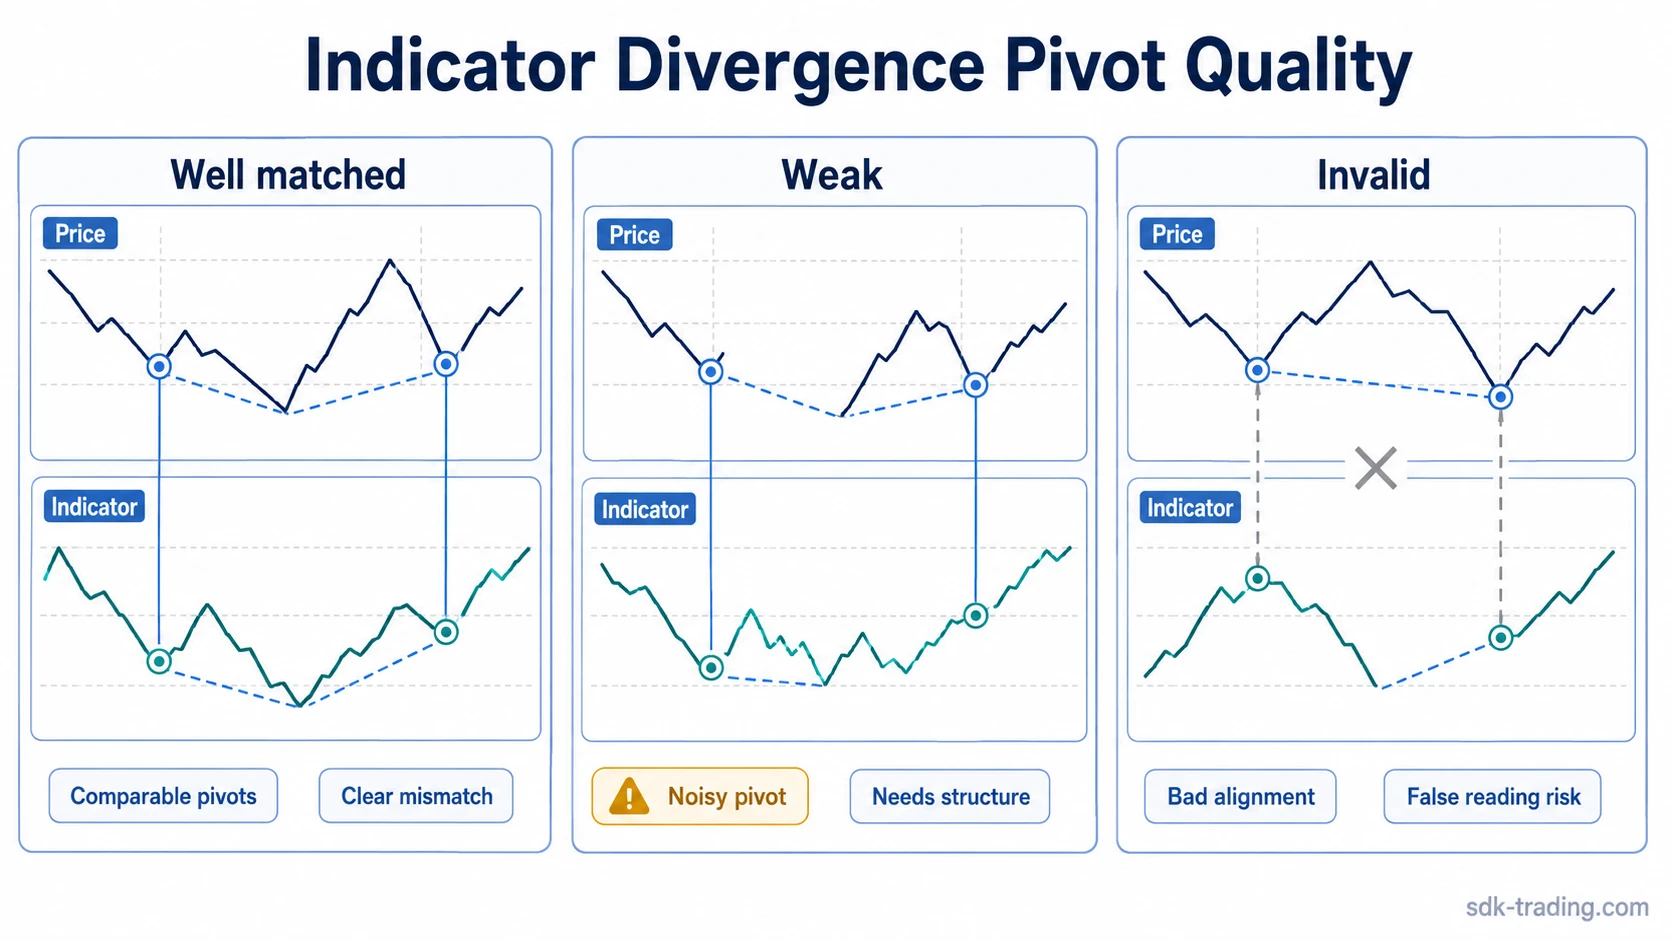
A useful divergence reading depends less on the label and more on the quality of the comparison. Clean readings compare similar pivots and then wait for price behavior to support or weaken the idea.
| Reading quality | What it looks like | Why it matters |
|---|---|---|
| Clean | Price and indicator pivots are comparable, the mismatch is clear, and later price behavior tests the same area meaningfully. | The divergence becomes easier to interpret because the mismatch is not created by random pivot selection. |
| Weak | The mismatch exists, but one pivot is minor, the indicator is noisy, or price has not challenged any meaningful structure. | The reading may describe momentum change, but it does not yet say much about control. |
| Invalid | The price pivots and indicator pivots do not correspond, or the supposed divergence disappears after using a consistent swing comparison. | The pattern is likely a drawing error or a settings artifact rather than useful chart information. |
False Divergence and Common Mistakes
False divergence often appears when the indicator reacts before price structure changes. Momentum can slow while price continues trending, especially when the market is still accepting higher highs, lower lows, or trend-side pullbacks.
Common mistake: drawing divergence from the most convenient indicator points instead of matching the relevant price swings. The line may look persuasive, but the comparison becomes unreliable if the pivots do not belong to the same move.
Parameter sensitivity also matters. A shorter lookback can create more divergence readings, while heavier smoothing can hide smaller shifts or delay the indicator response. That does not make one setting universally better; it means the indicator should be interpreted according to what it is designed to measure.
Indicator Divergence Example in Context
Price pushes into a prior resistance area and makes a marginal higher high. The oscillator fails to make a matching higher high, so bearish divergence is visible. The first read is tempting because price has stretched while momentum has not confirmed the extension.
The reading is still incomplete if price holds above the tested area and buyers continue accepting higher prices. It becomes more defensible only if the breakout attempt fails, price returns below the tested area, and the next recovery attempt stalls. If price keeps holding structure, the divergence may simply describe slower momentum inside an intact advance.
Confirmation Without Overstating Divergence
Confirmation should be understood as a structure check, not as an instruction to act. Useful follow-up evidence can include whether price accepts or rejects the tested area, whether the next swing expands or stalls, and whether the indicator is being used for a role it can reasonably perform.
| Check | Useful question | Risk if ignored |
|---|---|---|
| Pivot quality | Are the compared price and indicator swings actually related? | A forced line can create a false divergence reading. |
| Price structure | Has price failed to hold, reclaim, or accept the relevant area? | The indicator may warn of momentum change while structure remains intact. |
| Indicator role | Is the tool measuring momentum, range position, smoothing, or trend change? | The same label may be applied to indicator outputs with different meanings. |
| Later behavior | Does later price action support the divergence or absorb it? | Divergence can persist without becoming a useful directional read. |
Where Indicator Divergence Fits Next
Indicator divergence is best treated as one layer of interpretation. It can identify disagreement between price and an indicator, but it does not replace structure, pivot quality, follow-through, or the specific behavior of the indicator being used.
Broader divergence work should separate the price-versus-tool disagreement from the indicator-specific calculation behind the reading. RSI-specific divergence adds another layer because RSI has its own range behavior, momentum compression, and overbought or oversold interpretation limits.
FAQ
Does indicator divergence confirm a reversal?
No. Indicator divergence can show that price and an indicator are no longer confirming each other, but it does not prove that price will reverse. Price structure and follow-through still matter.
Can divergence stay visible while the trend continues?
Yes. Divergence can persist when momentum slows but price structure still holds. That is why a divergence reading can remain unresolved until price behavior changes.
Why do different indicators show different divergence?
Different indicators use different formulas, smoothing, lookback periods, and range logic. A mismatch can appear clearly on one tool and weakly or not at all on another.
What makes an indicator divergence reading weak?
A weak reading usually has poor pivot alignment, noisy indicator movement, unclear price structure, or no later behavior that supports the mismatch.