Trading indicators help beginners sort market information into measurable jobs: trend direction, trend strength, smoothing, momentum, volatility, volume participation, and structure context. The first task is not to find an automatic decision tool. It is to understand what each indicator measures, what it ignores, and when its reading may be repeated by another indicator using the same input.
Definition: Trading indicators are chart-based tools that transform price, volume, range, or time data into a simpler reading. They can support technical analysis, but they do not prove market direction or replace context.
Key Points
- Beginners should group indicators by market job before adding more tools to a chart.
- Moving averages mainly smooth price; they do not prove that a trend is safe or durable.
- ADX measures trend strength, not bullish or bearish direction by itself.
- Several indicators can appear to agree because they are transforming the same price input.
- Thresholds and crossovers need context from price structure, volatility, and follow-through.
What Trading Indicators Help Beginners Sort First
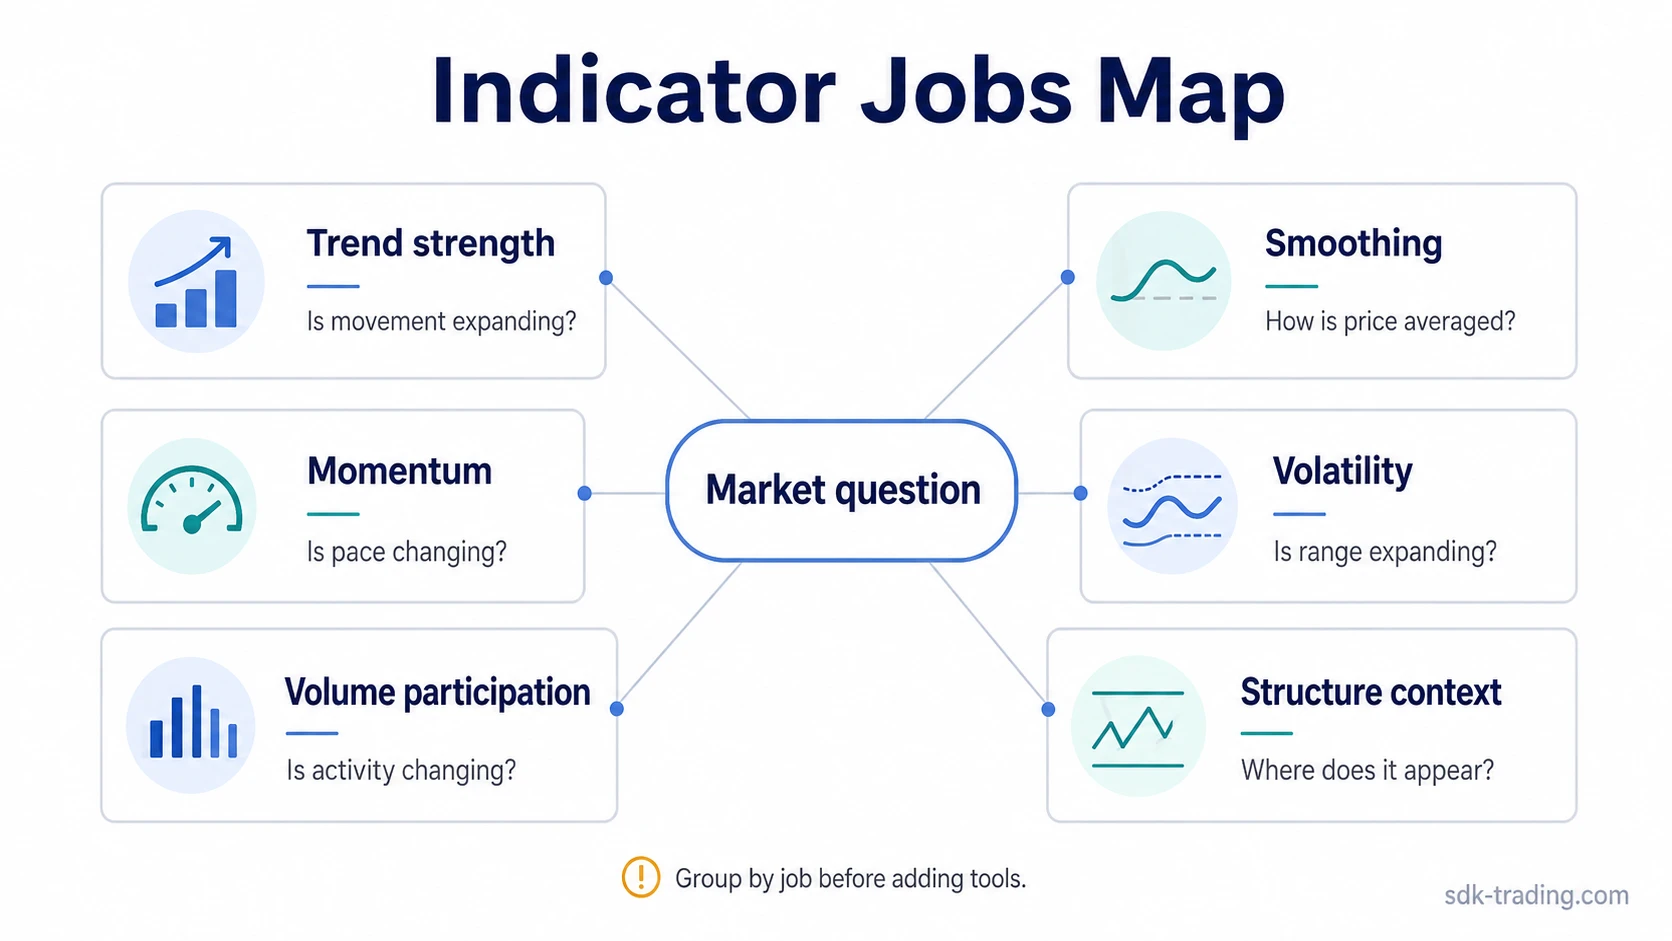
The cleanest starting point is the market question. A beginner who starts with “which indicator is best?” often collects tools before knowing what problem each tool is supposed to solve. A better first filter is whether the indicator is measuring direction, strength, smoothing, momentum, volatility, participation, or structure.
That separation matters because two indicators can look different while answering a very similar question. A fast moving average, a weighted average, and another smoothing tool may all react to the same price movement. Their agreement can help describe that movement, but it is not the same as independent evidence from volume, volatility, or market structure.
Main Indicator Types and What They Measure
| Market question | Indicator family | What it measures | Common beginner misread |
|---|---|---|---|
| Is price moving in a directional path? | Trend and smoothing tools | Average price behavior over a chosen lookback period | Treating a sloping line as proof that the trend must continue |
| How strong is the directional movement? | Trend-strength tools | The degree of directional strength or expansion | Reading strength as direction without checking price structure |
| Is movement stretched or losing pace? | Momentum tools | The speed or rate of price change | Treating a threshold as an automatic reversal condition |
| Is range expanding or compressing? | Volatility tools | How much price is moving relative to recent behavior | Confusing larger movement with reliable direction |
| Is activity expanding with price movement? | Volume and participation tools | Whether participation changes alongside price behavior | Assuming high volume always confirms the move |
| Where is the move happening? | Structure context | Location relative to prior highs, lows, ranges, and reaction areas | Reading the indicator without checking where the reading appears |
Beginner Indicator Route Table
The clearest learning order starts with the job each tool performs. After that, individual indicators become easier to compare because their differences are tied to construction, responsiveness, and interpretation limits.
| Learning question | Indicator route | What to focus on first | Misread to avoid |
|---|---|---|---|
| How can trend strength be separated from trend direction? | ADX trend-strength reading | Whether directional movement is strengthening or weakening | Using ADX alone as a bullish or bearish direction tool |
| How can adaptive smoothing reduce some moving-average noise? | ALMA adaptive smoothing | How smoothing changes the visual shape of trend reading | Assuming a smoother line is automatically more accurate |
| How can a moving average react faster to recent price? | EMA responsive smoothing | How recent prices receive more influence than older prices | Treating faster response as better evidence in every market condition |
| How can a moving average reduce lag while staying smooth? | HMA low-lag smoothing | The tradeoff between responsiveness and possible overreaction | Reading reduced lag as a guarantee of cleaner interpretation |
| What is the simplest baseline for average price behavior? | SMA baseline moving average | The average closing price over a fixed lookback period | Assuming a price crossing the average proves a completed trend change |
| How can recent prices receive stronger weight without using EMA construction? | WMA weighted smoothing | How weighting changes the line’s response to recent movement | Stacking weighted tools and mistaking repeated price input for new evidence |
Common Beginner Misreads
Indicator mistakes usually come from treating a measurement as a conclusion. A tool can describe momentum, trend strength, or volatility, but the interpretation still depends on where the reading appears and what price does afterward.
| Indicator reading | What it can suggest | What it does not prove |
|---|---|---|
| A moving average slopes upward | Recent average price is rising over the selected lookback | That price cannot reverse, stall, or enter a range |
| A momentum tool reaches an extreme threshold | Price movement may be stretched relative to recent behavior | That reversal must begin immediately |
| ADX rises | Directional movement is strengthening | Whether the direction is bullish or bearish without separate context |
| Volume expands | Participation or activity has increased | That the move is automatically healthy or sustainable |
| Several smoothing tools point the same way | Price has moved enough to affect multiple transformations | That each tool is giving independent confirmation |
Duplicate Input Risk
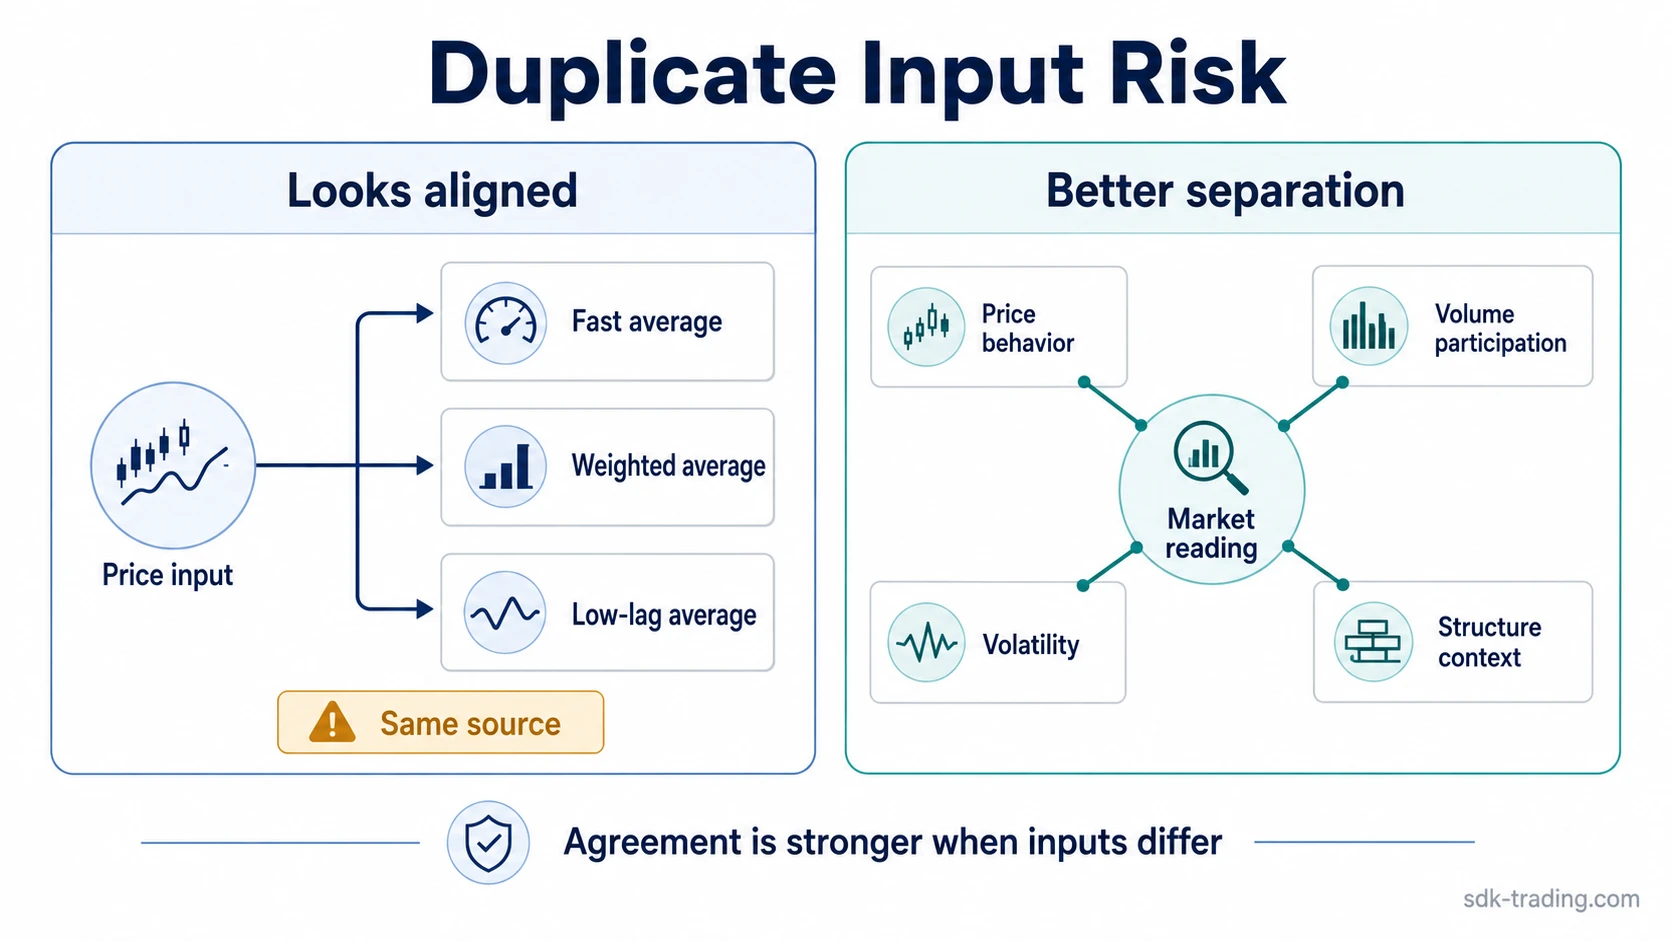
A chart can look more convincing when several indicators point in the same direction, but agreement is weaker when those indicators are built from the same input. Three moving-average variants may all respond to the same price advance. That can confirm that price has moved, but it may not add a separate view of participation, volatility, or structure.
A practical scenario is a chart where a fast average, a weighted average, and a low-lag average all turn upward after a sharp rally. The visual agreement can feel decisive. The risk is false independence: the chart may show several lines agreeing while the evidence still comes from one price movement. A stronger interpretation would need a separate check, such as whether price is holding above a prior reaction area, whether range behavior supports continuation, and whether participation is expanding or fading.
What to Learn First Without Ranking Indicators
A beginner path should not rank indicators as universally better or worse. The learning sequence should move from simple measurement to more sensitive transformations, then into interpretation limits.
- Start with baseline smoothing. A simple moving average helps show how price behaves relative to an average, but it can lag during turning points and flatten during ranges.
- Add responsiveness carefully. Responsive averages can adjust faster, but faster movement can also create more noise when price is choppy.
- Separate strength from direction. Trend-strength tools can help show whether movement is expanding, but direction still needs price context.
- Compare weighting and lag. Weighted and low-lag tools change how recent price affects the line, which can help interpretation only when the tradeoff is understood.
- Check for repeated evidence. A chart overloaded with similar tools can create confidence without adding much new information.
Limits That Keep Indicator Reading Safer
Indicators are clearer when their limits are visible. Lag means many tools describe what has already happened. Thresholds can stay extreme longer than expected. Volume can expand for continuation, exhaustion, or forced activity. Volatility can show opportunity or instability without giving direction by itself.
Common mistake: adding more indicators to solve uncertainty. More tools can increase confusion when they measure the same input, use similar lookback windows, or repeat the same smoothing logic. Fewer indicators with clearer jobs can produce a cleaner reading than a crowded chart with overlapping measurements.
The practical distinction is simple: an indicator can help frame a question, but price behavior, location, participation, volatility, and follow-through shape whether the reading remains useful. When those pieces conflict, the indicator reading should stay conditional.
How to Choose the Next Indicator to Study
Choose the next indicator by the market job it answers. A smoothing tool helps simplify average price behavior, a trend-strength tool asks whether movement is expanding, and a participation tool asks whether activity is changing alongside price.
Study one tool against one question before adding another. If the next indicator measures the same price movement with a different smoothing rule, it may refine the view but not add independent evidence. A cleaner sequence is to compare direction, strength, participation, volatility, and structure before treating indicator agreement as meaningful.
FAQ
What indicators should beginners learn first?
Beginners usually benefit from learning indicator categories before choosing a favorite tool. Baseline smoothing, responsive moving averages, trend strength, momentum, volatility, and volume participation create a clearer foundation than a ranked list.
Are moving averages enough for beginner technical analysis?
Moving averages can help simplify trend direction and average price behavior, but they do not explain momentum, volatility, volume participation, or structure by themselves.
Does a high or low indicator reading create a trade decision?
No. A threshold reading can highlight a condition, but the interpretation still depends on price location, follow-through, volatility, and broader market context.
Why can several indicators give the same reading?
Several indicators can agree because they are built from the same price input. Agreement is more useful when the tools measure different market jobs rather than repeating the same transformation.