In technical analysis, HMA usually refers to the Hull Moving Average, a moving-average trend overlay designed to reduce lag while keeping the line smoother than many basic moving averages. It is applied to price data and plotted on the chart so directional changes in recent weighted price movement become easier to observe.
The useful boundary is simple: HMA can make directional changes easier to see, but it does not predict the next price move or confirm a trend by itself. Its faster response comes from the calculation, not from foresight.
Key Points
- HMA means Hull Moving Average in a technical-analysis context.
- It is a moving-average trend overlay, not an oscillator or a complete trading system.
- The calculation uses weighted moving averages to reduce lag and then smooth the result again.
- A rising or falling HMA line describes recent weighted price movement, not a guaranteed direction.
- Shorter lengths react faster, but they can also create more misleading turns in sideways markets.
- Repeated price crosses through HMA usually warn that price is rotating around the line rather than accepting a clean trend.
What Is the HMA Indicator?
The HMA indicator is the Hull Moving Average, a moving-average calculation applied to price data. It is usually shown as a line over the price chart, where it helps describe whether recent weighted price movement is rising, falling, flattening, or rotating.
Definition: The HMA indicator is a WMA-derived moving average that attempts to reduce lag by emphasizing recent price movement, then smoothing the result with another weighted moving average. It shows a smoothed historical price calculation, not a forecast or standalone trade signal.
HMA belongs in the same broad family as moving averages because it transforms price into a smoother line. The difference is that HMA uses a multi-step weighted calculation rather than a simple arithmetic average or a single exponential update.
That makes HMA more responsive than many slower averages. Responsiveness, however, is only a calculation feature. A line that turns quickly can reveal changing pressure, yet it can also react to temporary swings that do not become sustained trends.
How the Hull Moving Average Calculation Works
The Hull Moving Average calculation starts with weighted moving averages. A weighted moving average gives more influence to recent prices than to older prices inside the selected lookback period. HMA then uses several WMA steps to pull the line closer to recent price behavior while still applying a final smoothing step.
Compact calculation sequence:
- Calculate a weighted moving average over half the selected length:
WMA(n / 2). - Calculate a weighted moving average over the full selected length:
WMA(n). - Double the shorter WMA and subtract the full-length WMA:
2 x WMA(n / 2) - WMA(n). - Smooth that result with a WMA using the square root of the selected length:
WMA(sqrtn).
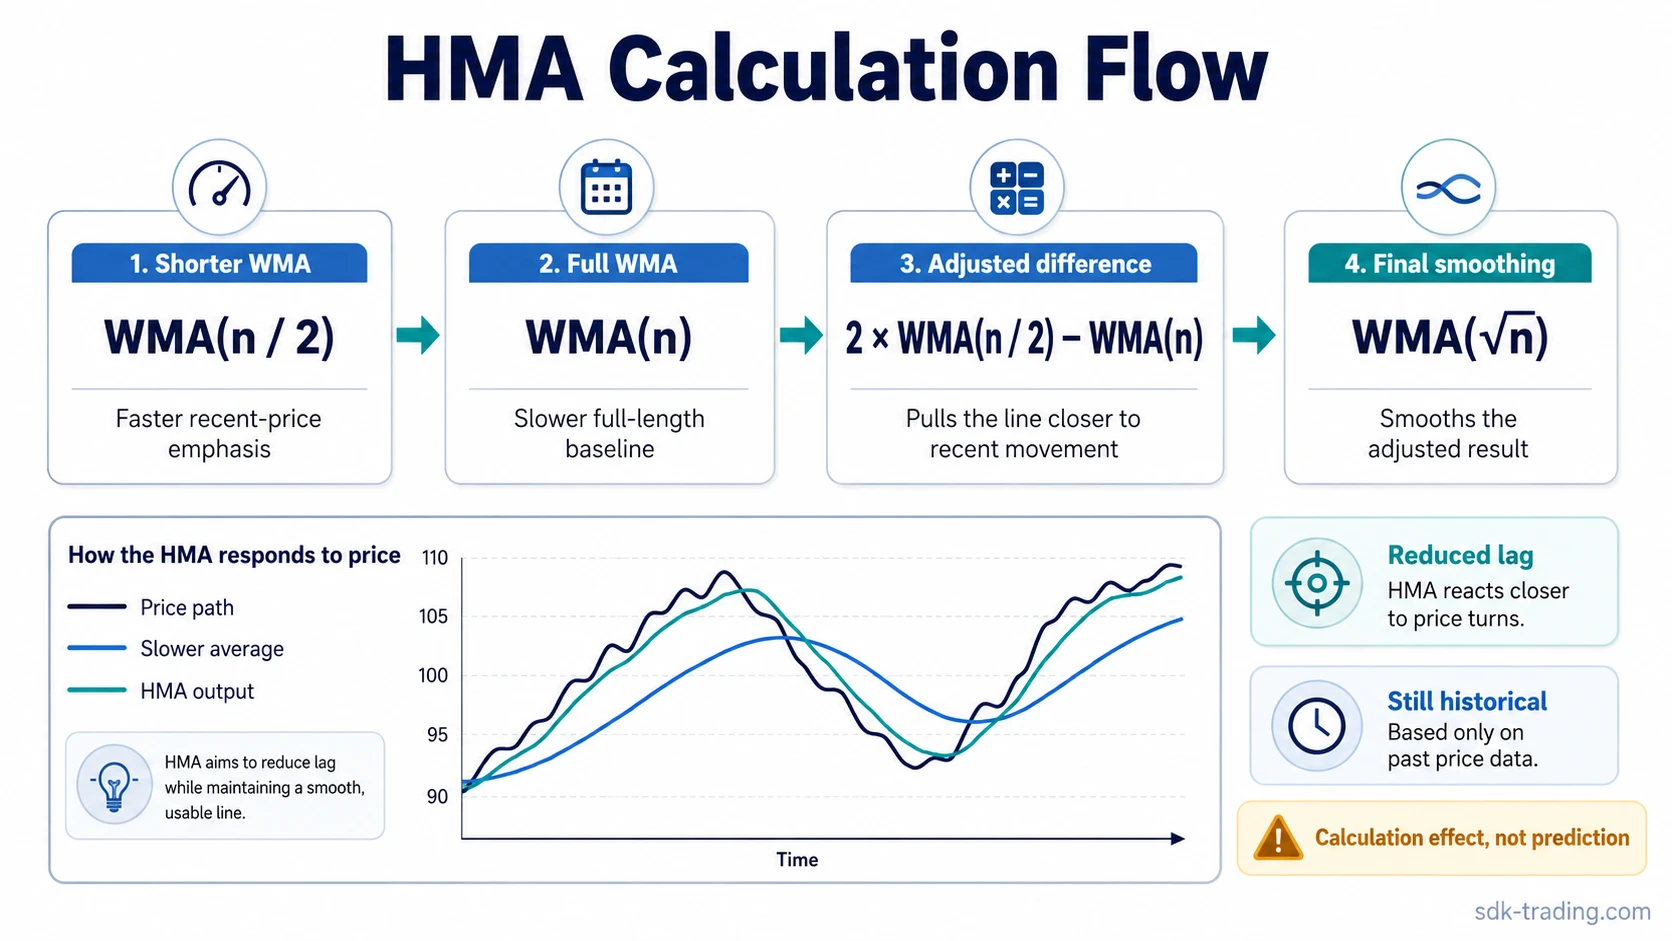
The middle step creates the faster response. It gives extra weight to the shorter weighted average and offsets part of the slower full-length average. The final square-root smoothing step keeps the output from behaving like a raw fast average.
For example, with a 16-period HMA, the calculation compares an 8-period WMA with a 16-period WMA, then smooths the adjusted result with a 4-period WMA because the square root of 16 is 4. The interpretation remains the same: the line is designed to reduce lag, not remove it.
What HMA Shows on a Chart
HMA shows a smoothed line based on recent weighted price movement. When the line slopes upward, recent weighted prices are moving higher. When the line slopes downward, recent weighted prices are moving lower. When the line flattens, directional pressure is often unclear or rotational.
A turn in HMA can show that the weighted calculation has changed direction. On its own, that turn is only a chart observation. It becomes more useful when the broader structure also shows acceptance, continuation, or a cleaner directional sequence.
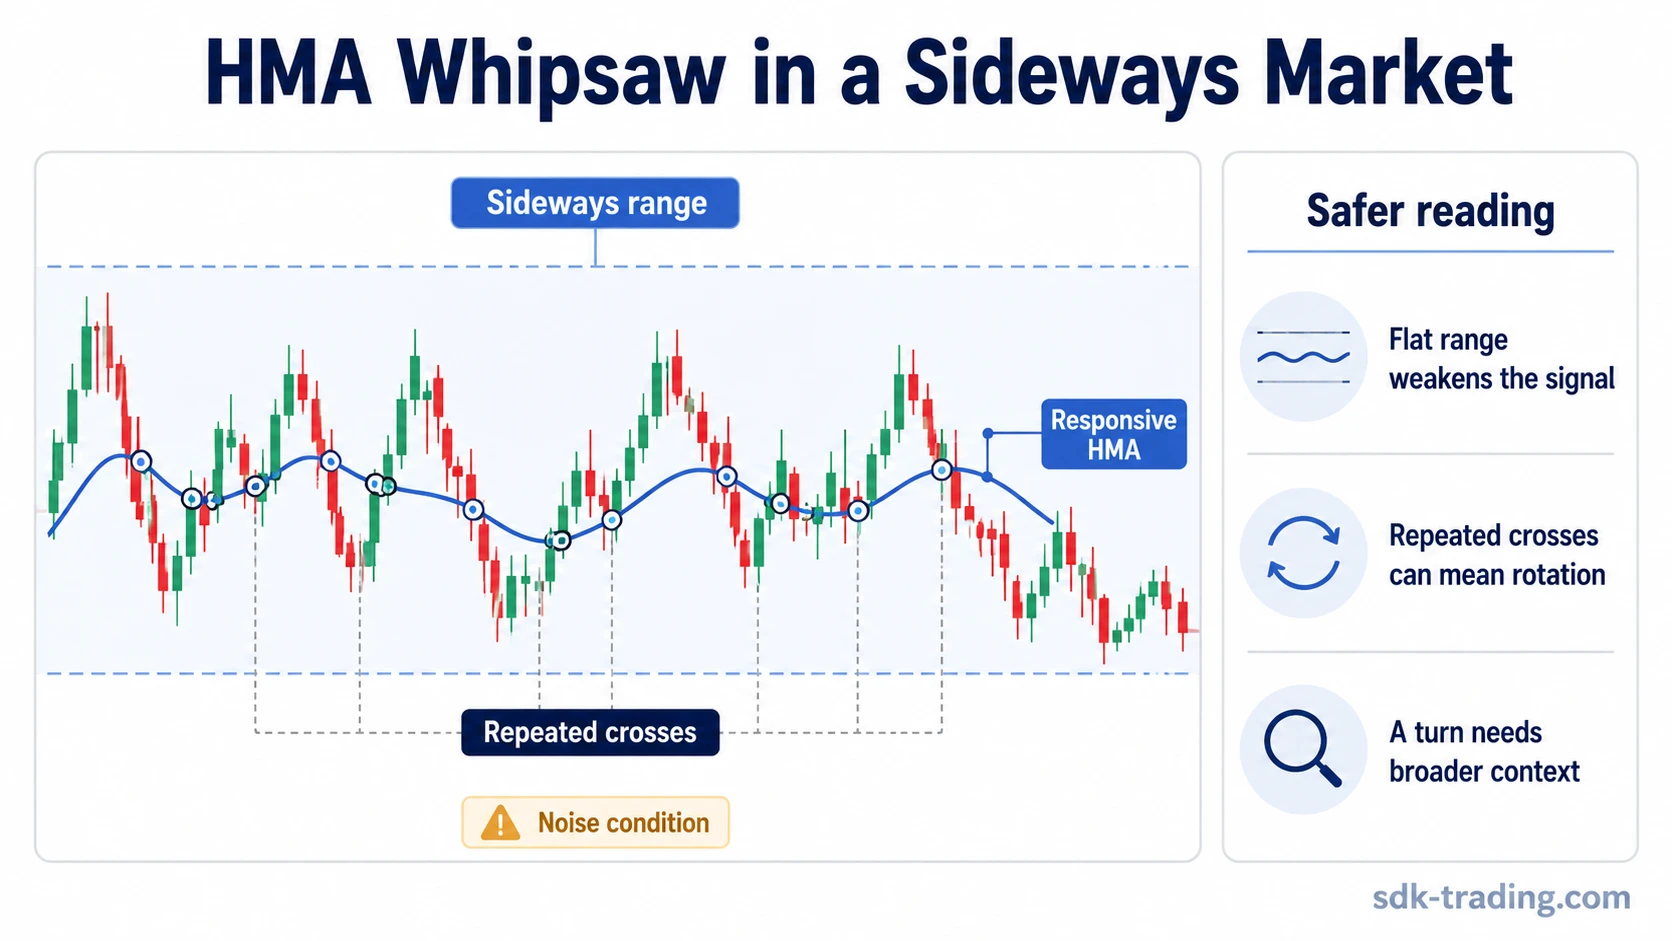
Price can also move above or below the HMA line. That relationship may describe whether price is trading on one side of its recent smoothed path, but a simple cross is weak on its own. In rotational markets, price can cross the line repeatedly without producing accepted trend behavior.
| Chart observation | What it can show | Interpretation boundary |
|---|---|---|
| Rising HMA | Recent weighted price movement is moving upward. | The line alone is not enough to define a complete bullish decision. |
| Falling HMA | Recent weighted price movement is moving downward. | The line alone is not enough to define a complete bearish decision. |
| Flat HMA | Directional pressure may be unclear or rotating. | Flat behavior can occur before a trend, during a pause, or inside noise. |
| Price crossing HMA | Price is moving across its recent smoothed path. | A cross needs surrounding structure before it has useful context. |
| Frequent HMA turns | The line is reacting quickly to changing price movement. | Repeated turns can reflect rotation rather than repeated valid reversals. |
HMA Inputs and Output
Most charting platforms present HMA with a small number of inputs. The exact labels can vary, but the main control is usually the length. That length determines how much historical price data the calculation uses before the final HMA line is plotted.
| Input or output | Meaning | Interpretation effect |
|---|---|---|
| Price source | The price series used in the calculation, often close price by default. | Changing the source changes what price behavior the line reflects. |
| Length | The selected lookback period for the HMA calculation. | Shorter lengths react faster. Longer lengths smooth more but respond more slowly. |
| Optional displacement | A platform setting that may shift the plotted line visually. | If offered, displacement changes chart placement rather than the underlying calculation logic. |
| HMA output line | The final smoothed Hull Moving Average line. | It displays a reduced-lag moving-average path based on historical data. |
Length selection changes the balance between speed and smoothing. A short HMA can follow recent movement closely, but it is more exposed to short-lived swings. A longer HMA can filter more noise, but it may turn later when price behavior changes.
How to Read HMA Without Treating It as a Signal
HMA is easier to interpret when the reading starts with condition quality instead of signal language. A cleaner reading usually appears when price structure and the HMA line point to a similar directional environment. A weaker reading appears when the line turns but price does not accept the new direction. A misleading reading appears when the line keeps turning inside a range.
| Reading condition | What the HMA behavior means | Safer interpretation |
|---|---|---|
| Cleaner condition | HMA slope, price structure, and recent price movement are broadly aligned. | The line may help describe a cleaner directional environment. |
| Weak condition | HMA turns, but price remains choppy or fails to hold direction. | The line is reacting, while the chart has not shown stable acceptance. |
| Misleading condition | Price crosses HMA repeatedly while the line flattens or whipsaws. | The line is more likely reflecting rotation than trend behavior. |
This distinction keeps HMA in a descriptive role. It can show how a weighted moving-average path is changing, but the surrounding chart structure still determines whether the movement is clean, weak, rejected, or unresolved.
When HMA Can Give Misleading Readings
The same responsiveness that makes HMA faster can also make it turn too often when price is moving sideways. In a range, price can rotate above and below the line while the HMA slope changes repeatedly. That can create the appearance of repeated direction shifts even though the market is not accepting a clean trend.
Main limitation: HMA reduces lag, but it does not remove noise. A faster line can react to short-term movement before the broader chart has shown durable direction.
Short settings increase this risk because the calculation is more sensitive to recent price changes. Fast reversals create a similar problem. If price snaps in one direction and then quickly returns to the prior range, HMA may turn after the movement has already lost quality.
Crossover readings need the same caution. Because HMA is already designed to reduce lag, using one HMA crossover as a complete confirmation can be weaker than it appears. If both lines are highly responsive, the crossover can occur after a short burst of movement that does not become a durable trend.
- Sideways range: HMA can flatten and turn repeatedly while price rotates.
- Short length: the line may react faster, but more minor swings can affect it.
- Fast reversal: a sudden move can pull the line before price accepts direction.
- Repeated crosses: price crossing through HMA again and again usually weakens the reading.
- Crossover-only logic: HMA crossovers can be noisy when used without structure or context.
HMA vs Related Moving Averages
HMA is easiest to separate from nearby indicators by looking at its mechanism. It is not just a faster version of every moving average. It uses WMA transformations and square-root smoothing, which gives it a different behavior profile from simpler averages.
| Concept | Relation to HMA | Boundary |
|---|---|---|
| SMA | A simple arithmetic moving average. | Usually smoother and slower, with no weighted recent-price emphasis. |
| EMA | A moving average that uses exponential weighting. | EMA updates recursively, while HMA uses WMA transformations and final square-root smoothing. |
| WMA | The weighted moving average is a building block inside the HMA calculation. | HMA is a derived calculation, not a single WMA line. |
| ALMA | Another smoothing design used by some traders and platforms. | It is not the same mechanism as HMA with a different setting. |
| MACD | A momentum and trend-following indicator derived from moving-average relationships. | MACD is not a moving-average overlay with the same calculation structure as HMA. |
| Ichimoku Cloud | A broader trend-context system with multiple lines and a cloud structure. | It is not a lag-compression moving-average calculation like HMA. |
The controlled comparison matters because HMA can otherwise be misread as a universal replacement for other averages. A faster line can be useful for observing recent price movement, while slower averages and broader systems may answer different questions about context, smoothing, or structure.
FAQ
What does HMA mean in trading?
In trading and technical analysis, HMA usually means Hull Moving Average. It is a moving-average trend overlay designed to reduce lag while keeping the line smoother than many basic moving averages.
Is HMA a trend indicator?
HMA is commonly used as a trend-overlay indicator because it plots a smoothed moving-average line on the price chart. It can describe recent weighted price direction, but it does not define a trend by itself.
How is the Hull Moving Average calculated?
The Hull Moving Average uses weighted moving averages. It compares a WMA over half the selected length with a WMA over the full length, doubles the shorter WMA, subtracts the longer WMA, and then smooths the result with a WMA based on the square root of the length.
Does HMA remove lag?
No. HMA is designed to reduce lag, not remove it. The line still comes from historical price data, and a faster response can also make the indicator more sensitive to short-term noise.
Why can HMA be misleading in sideways markets?
In sideways markets, price can cross the HMA line repeatedly while the line turns up and down. That behavior can reflect rotation and noise rather than accepted trend movement.