The Ichimoku Cloud is a multi-line technical indicator framework that maps price against short-term midpoint pressure, longer baseline pressure, forward-shifted cloud boundaries, and a lagging close. Its structure is useful because the lines are read together. A cloud reading is context, not a standalone instruction to act.
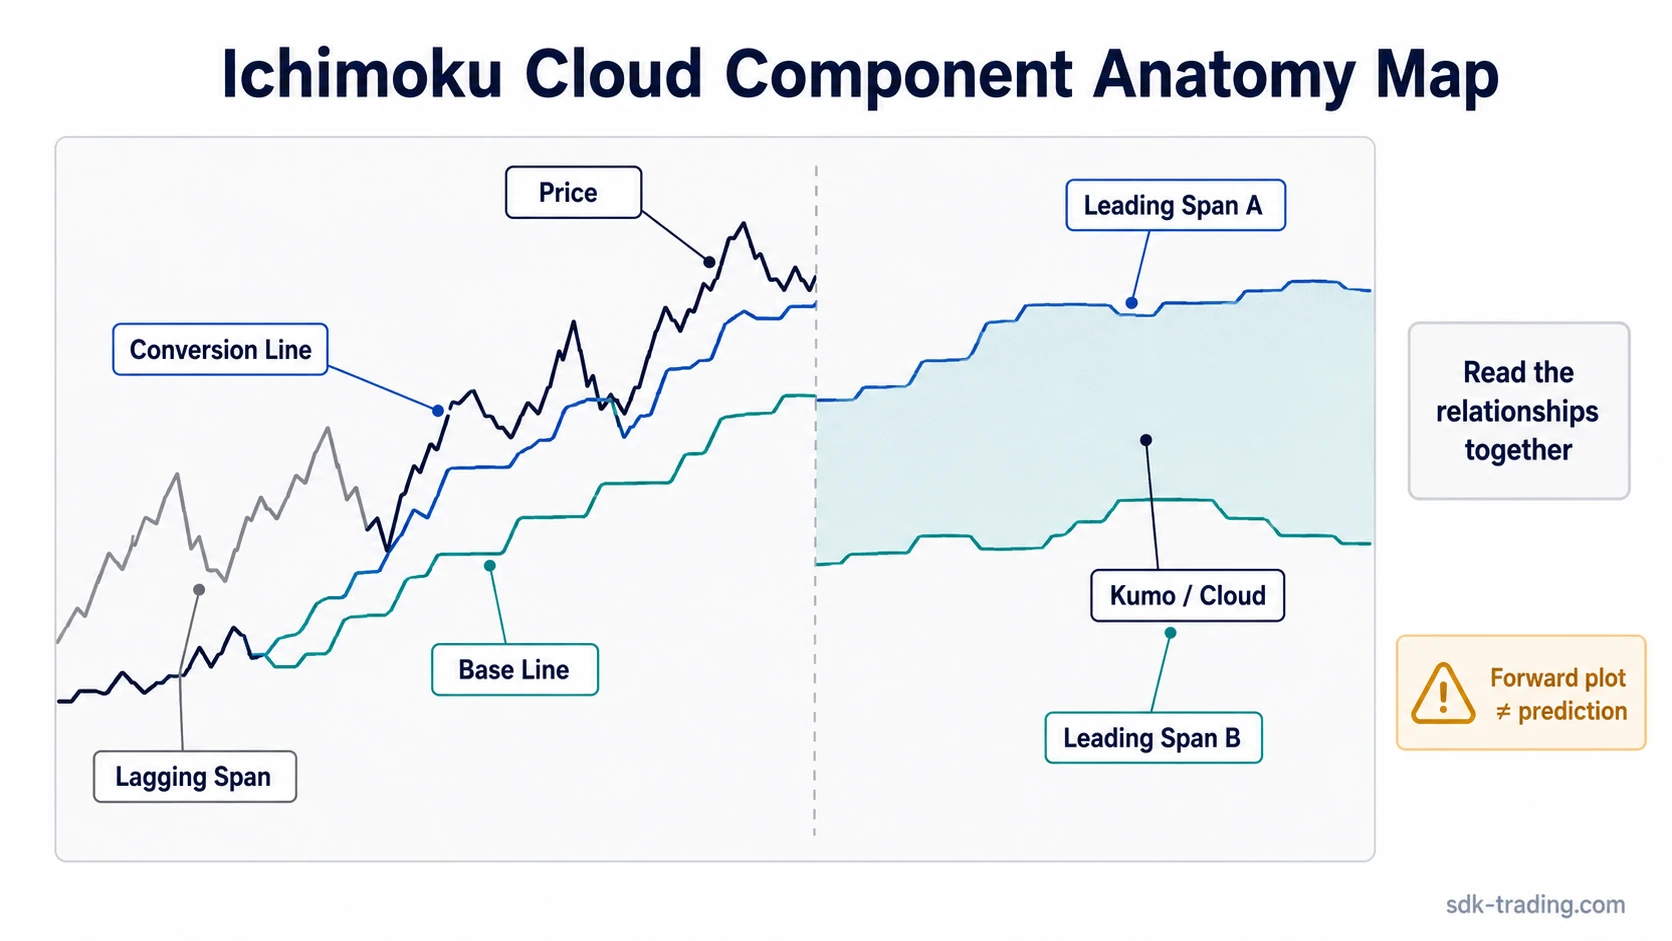
Unlike a single moving average, the Ichimoku Cloud combines several high-low midpoint calculations into one visual structure. The Conversion Line and Base Line show shorter and longer equilibrium points, the Leading Spans form the cloud, and the Lagging Span shifts the current close backward for comparison with earlier price action.
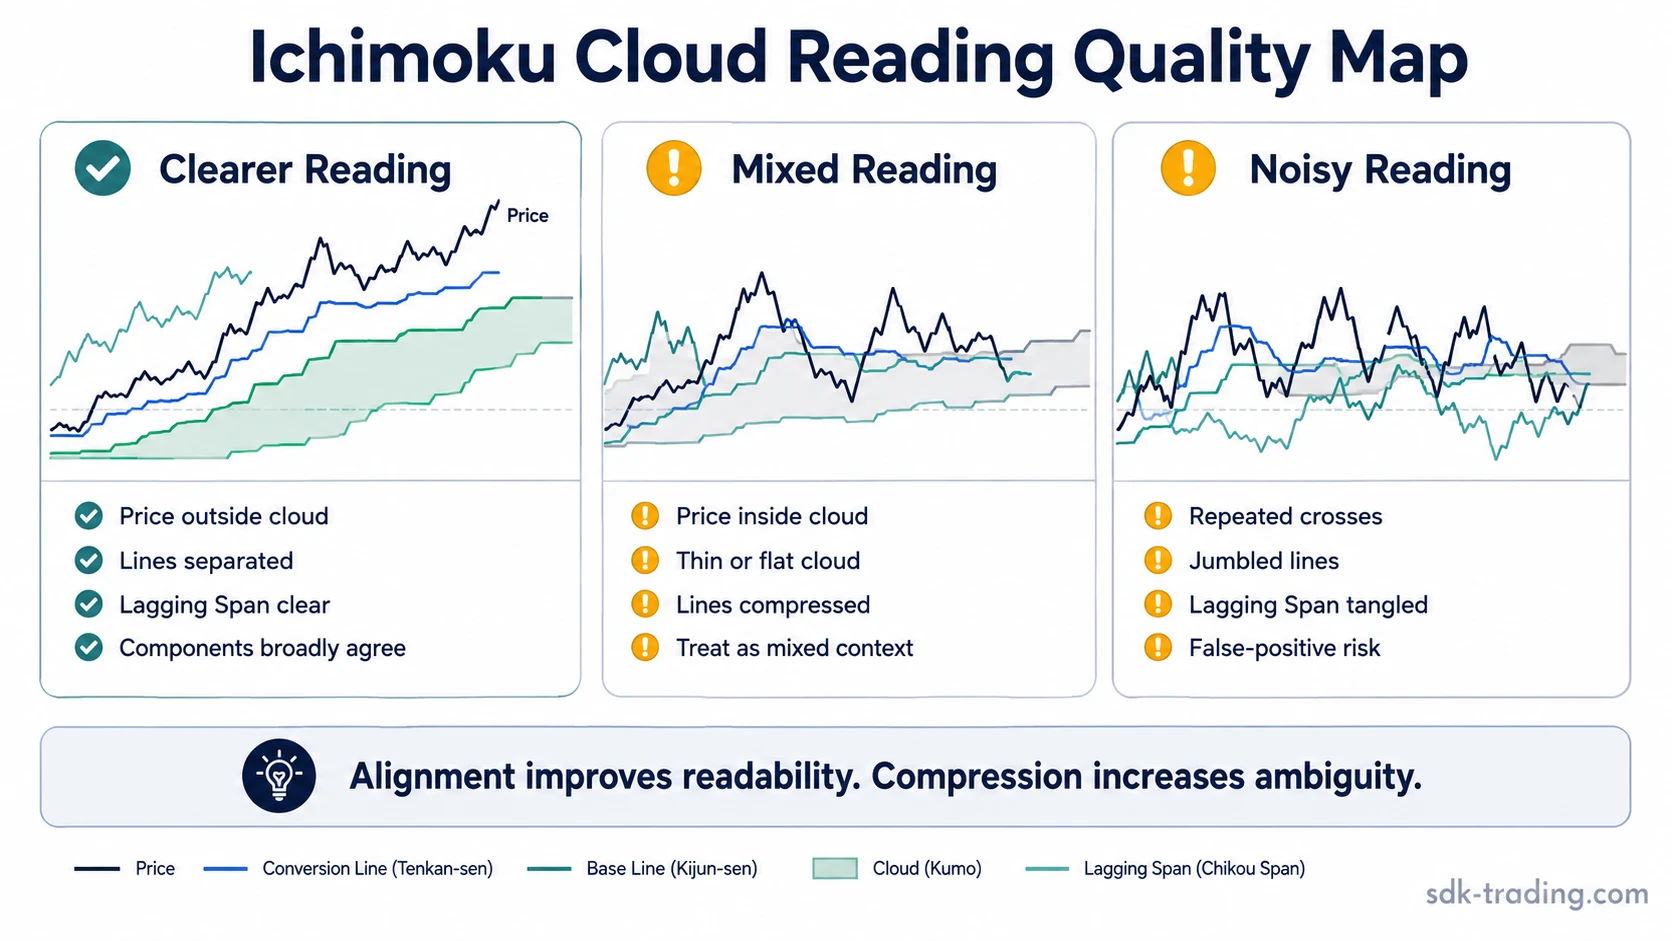
The strongest Ichimoku readings usually come from alignment. Price location, cloud shape, Conversion Line behavior, Base Line behavior, and Lagging Span context should broadly support the same interpretation. When those parts conflict, the cloud can become visually busy while the message becomes less useful.
Key Points
- The Ichimoku Cloud is a multi-line equilibrium framework, not one moving average.
- Its main parts are the Conversion Line, Base Line, Leading Span A, Leading Span B, Kumo, and Lagging Span.
- Most Ichimoku calculations use high-low midpoints over 9, 26, and 52 periods.
- The cloud is plotted forward, but that displacement does not mean the indicator predicts future price.
- Cloud readings weaken when price is inside the cloud, lines are compressed, or components conflict.
What Is the Ichimoku Cloud?
The Ichimoku Cloud, also called Ichimoku Kinko Hyo, is a technical indicator system designed to show market equilibrium at a glance. It uses multiple lines to compare price with recent high-low ranges, longer reference levels, projected cloud boundaries, and a lagging version of the current close.
The “cloud” is only one part of the full structure. It is the shaded area between two leading spans. The wider framework also includes the Conversion Line, Base Line, and Lagging Span, which means the indicator should not be reduced to price being above or below the cloud alone.
A cleaner Ichimoku reading appears when several parts of the structure agree. A weaker reading appears when price sits inside the cloud, the cloud becomes flat or thin, or the lines cluster together without a clear directional relationship.
Ichimoku Cloud Components
Each Ichimoku component has a separate job. The framework becomes easier to read when the parts are separated first, then recombined into one structural view.
| Component | Common name | What it shows |
|---|---|---|
| Tenkan-sen | Conversion Line | A short-term high-low midpoint, usually based on the last 9 periods. |
| Kijun-sen | Base Line | A longer high-low midpoint, usually based on the last 26 periods. |
| Senkou Span A | Leading Span A | The midpoint between the Conversion Line and Base Line, plotted forward. |
| Senkou Span B | Leading Span B | A longer high-low midpoint, usually based on the last 52 periods, plotted forward. |
| Kumo | Cloud | The area between Leading Span A and Leading Span B. |
| Chikou Span | Lagging Span | The current close plotted backward, usually 26 periods, to compare current price with earlier price. |
The names are less important than the relationships: short-term midpoint, longer midpoint, forward-shifted cloud range, and backward-shifted close.
How the Ichimoku Cloud Is Calculated
The standard Ichimoku settings are 9, 26, and 52 periods. These defaults are common, but they are not universal laws. Changing the timeframe, market, or session structure can change how useful the default settings appear.
| Line | Common formula | Default lookback or shift |
|---|---|---|
| Conversion Line | (9-period high + 9-period low) / 2 | 9 periods |
| Base Line | (26-period high + 26-period low) / 2 | 26 periods |
| Leading Span A | (Conversion Line + Base Line) / 2 | Plotted 26 periods forward |
| Leading Span B | (52-period high + 52-period low) / 2 | 52-period lookback, plotted 26 periods forward |
| Lagging Span | Current close | Plotted 26 periods backward |
The midpoint structure is the important distinction. Ichimoku does not smooth only closing prices in the same way that many moving averages do. It uses the midpoint between recent highs and lows, which makes the lines respond to range structure rather than closing-price smoothing alone.
The forward cloud is also a displacement, not a forecast. Leading Span A and Leading Span B are calculated from existing historical data and then plotted ahead of the current candle. That forward placement helps visualize future reference zones on the chart, but it does not reveal future price.
How to Read the Ichimoku Cloud
Ichimoku is read by checking relationships, not by isolating one line. A single component can be misleading when the rest of the structure disagrees.
Price relative to the cloud: Price above the cloud can show that current price is holding above the projected equilibrium zone. Price below the cloud can show that current price is below that zone. Price inside the cloud is usually more mixed because price is moving within the area between the two leading spans.
The inside-cloud condition is important. When price is inside the Kumo, the cloud is no longer a clean separator. It becomes a range of uncertainty where directional readings often need more caution.
Conversion Line and Base Line relationship: The Conversion Line responds faster because it uses a shorter lookback. The Base Line responds more slowly because it uses a longer lookback. When the Conversion Line is clearly separated from the Base Line, short-term pressure is easier to distinguish from the longer baseline. When the two lines flatten or compress together, the reading becomes less decisive.
Span A and Span B relationship: Leading Span A and Leading Span B form the cloud boundaries. A thicker cloud can show a wider equilibrium zone. A thin cloud can show a narrower zone where the boundary may be easier to cross. A cloud twist happens when the two leading spans change order, but the twist should be read as a structural change in the plotted cloud, not as a future-price promise.
Lagging Span context: The Lagging Span places the current close back against earlier price. This helps show whether the current close is clear of prior price structure or tangled inside it. When the Lagging Span overlaps earlier candles, the broader reading may be less clean even if the current candle appears strong relative to the cloud.
Clean, Weak, and Invalid Ichimoku Readings
The Ichimoku Cloud is most useful when it separates readable structure from visual noise. Clean readings come from broad component agreement; weaker readings come from compression, conflict, or repeated crosses.
| Reading type | Observable structure | Safer interpretation |
|---|---|---|
| Clean reading | Price location, cloud position, Conversion/Base relationship, Span A/B structure, and Lagging Span context broadly align. | The cloud structure is easier to interpret because the components point toward the same broad context. |
| Weak or mixed reading | Price is inside the cloud, the cloud is flat or thin, the Conversion and Base Lines are compressed, or the Lagging Span conflicts with prior price. | The structure is less decisive and should be treated as mixed context rather than a clear directional message. |
| Invalid or false-positive-prone reading | Lines are jumbled, repeated crosses happen quickly, price rotates through the cloud, or the structure is choppy. | The cloud may be creating visual noise rather than a reliable reading of directional pressure. |
The important distinction is that alignment improves readability, while compression increases ambiguity. A crowded cloud can look detailed without giving a cleaner directional message.
A repeated cross near a flat cloud is not the same as a clean structural shift. It may simply reflect price rotating through a compressed area where the lines are too close together to separate useful context from noise.
Common Misunderstandings About the Ichimoku Cloud
The forward cloud is not prediction: The cloud is plotted forward, but its inputs come from historical high-low ranges and line relationships. The forward placement makes the structure visible ahead of the current candle. It does not mean the indicator knows where price will move.
More lines do not mean more certainty: Ichimoku can look authoritative because several lines appear on the chart at once. The extra lines are useful only when they clarify relationships. When they overlap, flatten, or cross repeatedly, the chart may look more detailed while the reading becomes weaker.
The cloud is not a complete trading system by itself: The Ichimoku Cloud can organize trend, equilibrium, and context, but it does not define risk, position size, market fit, or decision responsibility by itself. Treating the cloud as a complete system can turn a context tool into a mechanical shortcut.
Cloud position is not enough on its own: Price above or below the cloud is only one part of the reading. The Conversion Line, Base Line, cloud thickness, Span A/B structure, and Lagging Span can change the quality of that reading.
Limitations of the Ichimoku Cloud
The main limitation of the Ichimoku Cloud is that it can become visually convincing even when the underlying structure is unclear. A chart with many lines can feel complete, but the reading still depends on whether those lines provide agreement or conflict.
| Limitation | Why it matters | What to watch |
|---|---|---|
| Choppy or sideways conditions | Price may rotate through the cloud and create repeated mixed readings. | Flat cloud, price inside the cloud, and frequent line crossings. |
| Visual clutter | Several lines can make the chart look more informative than it really is. | Overlapping lines, compressed spans, and unclear separation. |
| Lag and displacement | Some lines reflect past ranges or shifted values, so the structure can react after price has already changed. | Delayed Base Line movement or Lagging Span conflict with prior price. |
| Default settings | The common 9/26/52 settings may not fit every market, session structure, or timeframe. | Readings that look clean on one timeframe but noisy on another. |
| Component conflict | One part of the indicator may appear clear while another part disagrees. | Price outside the cloud while Lagging Span remains tangled in prior price. |
The practical mistake is reading the most visible part of the cloud while ignoring the rest of the structure. A cleaner process starts with the full relationship: price, cloud, Conversion Line, Base Line, Span A/B, and Lagging Span.
Ichimoku Cloud vs Moving Averages
Ichimoku and moving averages both help organize price context, but they are built differently. Many moving averages smooth closing prices into one line. Ichimoku uses high-low midpoints, displacement, and multiple line relationships to create a broader equilibrium map.
| Feature | Ichimoku Cloud | Typical moving average |
|---|---|---|
| Main input style | High-low midpoint calculations and shifted lines. | Usually closing-price smoothing. |
| Visual structure | Multiple lines plus a cloud zone. | Usually one or more smoothed lines. |
| Primary reading | Relationship between price, midpoint lines, cloud boundaries, and lagging context. | Relationship between price and smoothed trend direction. |
| Main risk | Too many components can create clutter or mixed readings. | One smoothed line can hide range structure or lag turning points. |
A moving-average tool such as the Hull moving average focuses more directly on smoothing and responsiveness. Ichimoku is broader because it combines midpoint logic, displacement, and cloud context in one framework.
Adjacent tools can also answer different questions. For example, MACD momentum focuses on the relationship between moving averages and momentum changes, while Ichimoku focuses on multi-line equilibrium and cloud structure.
When the Ichimoku Cloud Is Most Useful
The Ichimoku Cloud is most useful when current price can be compared against several reference layers at once: the cloud, the Conversion Line, the Base Line, the leading spans, and the Lagging Span.
A useful Ichimoku review starts with a simple sequence: locate price relative to the cloud, check whether the Conversion Line and Base Line are separated or compressed, inspect the cloud’s thickness and twist, then compare the Lagging Span with prior price. If those checks do not agree, the reading should remain mixed.
The cloud becomes less useful when the chart is crowded, price is rotating through the cloud, or the reader is looking for a single line to make the decision. In those conditions, the indicator may show complexity without adding clarity.
Ichimoku Cloud FAQ
Is the Ichimoku Cloud a leading indicator?
The Ichimoku Cloud includes leading spans because part of the structure is plotted forward. That does not make it a prediction tool. The forward cloud is based on historical high-low midpoint calculations and shifted chart placement.
What are the main Ichimoku Cloud components?
The main components are the Conversion Line, Base Line, Leading Span A, Leading Span B, the Kumo or cloud, and the Lagging Span. Together they show short-term midpoint pressure, longer baseline context, cloud boundaries, and prior-price comparison.
When does the Ichimoku Cloud become unreliable?
The reading becomes less reliable when price is inside the cloud, the cloud is flat or thin, lines are compressed, crosses repeat quickly, or the Lagging Span conflicts with prior price. These conditions can turn the cloud into visual noise rather than clear context.