MACD is a lagging momentum indicator built from the difference between two exponential moving averages. Its visible reading comes from the MACD line, the signal line, the histogram, and zero-line context. A MACD signal line cross and MACD histogram expansion can show a changing momentum relationship, but the indicator is still calculated from historical price data rather than from a forward prediction.
Key Points
- MACD stands for Moving Average Convergence Divergence.
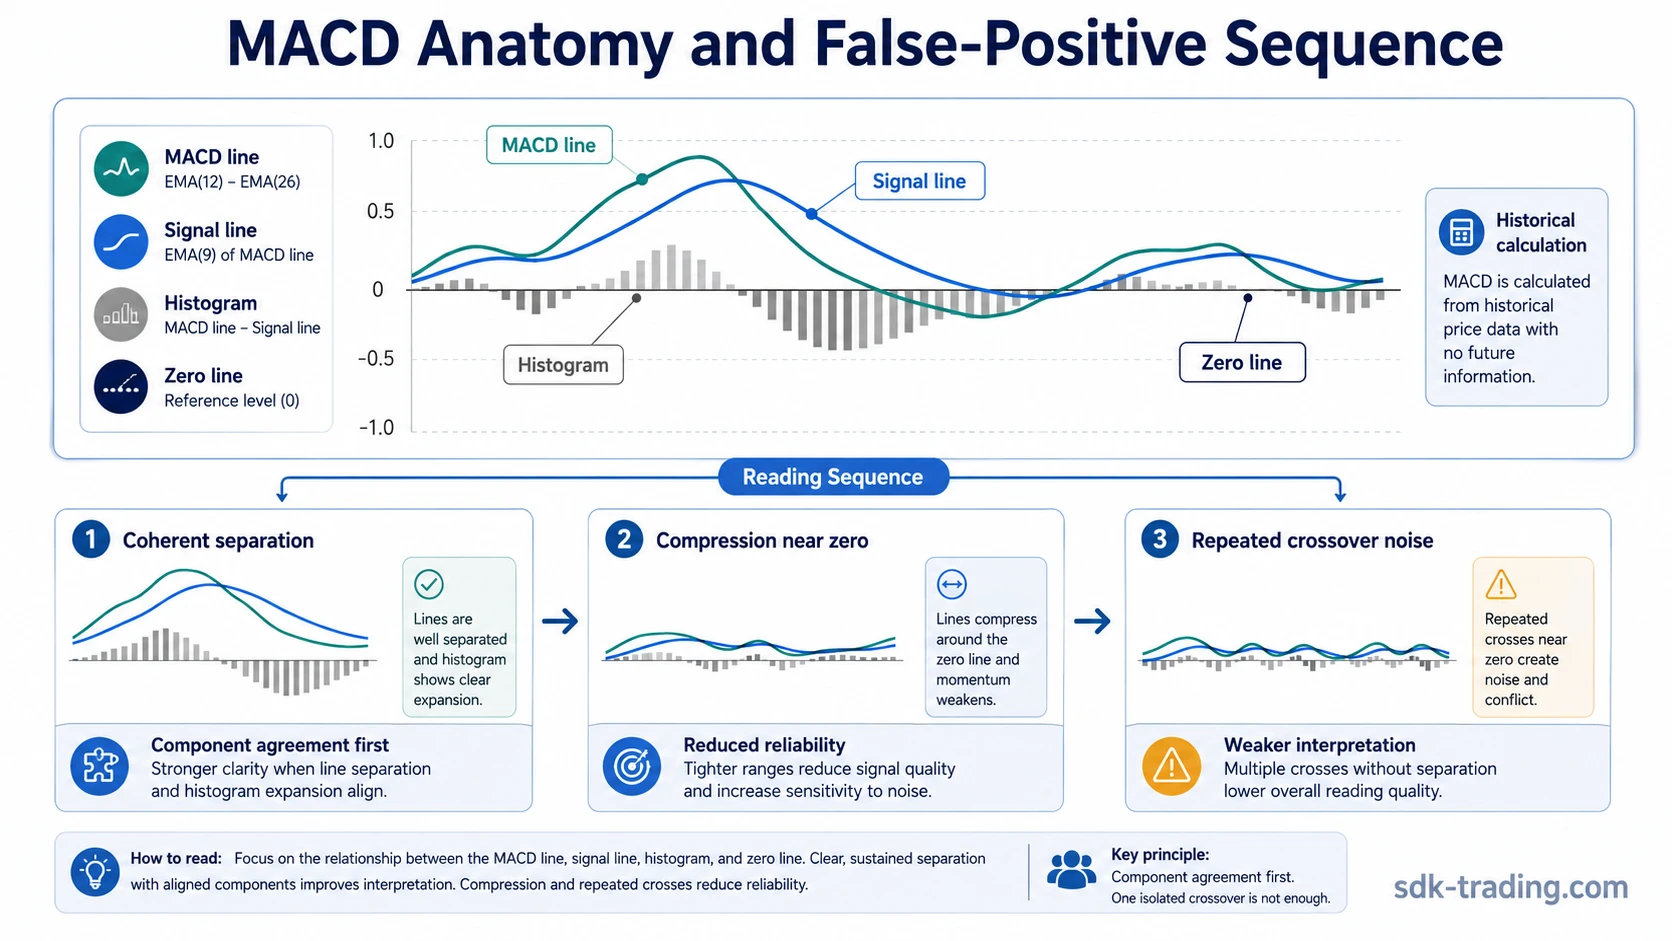
- The MACD line usually compares a 12-period EMA with a 26-period EMA.
- The signal line is usually a 9-period EMA of the MACD line.
- The histogram shows the distance between the MACD line and the signal line.
- MACD readings weaken when crossovers repeat near the zero line or inside a sideways range.
Definition: MACD is a trend and momentum indicator that compares shorter-term and longer-term exponential moving averages, then uses a smoothed signal line and histogram to show how that relationship is changing.
What Is MACD?
MACD means Moving Average Convergence Divergence. The name describes the relationship between two moving averages: they converge when the distance between them narrows and diverge when the distance between them expands.
As an indicator, MACD does not measure price directly. It measures how a shorter EMA is positioned against a longer EMA, then smooths that relationship into a signal-line comparison. That makes MACD a lagging momentum read, not a leading forecast. It can help describe whether relative momentum is expanding, contracting, or losing coherence, but it still reacts to price data that has already formed.
A MACD lagging momentum read is strongest when the line, signal line, histogram, and zero-line context are checked together rather than isolated. A crossover, histogram expansion, or movement above the zero line needs surrounding market context before the reading has much diagnostic value.
How MACD Is Calculated
The standard MACD calculation starts with two exponential moving averages. The most common default setting subtracts the 26-period EMA from the 12-period EMA. The result is the MACD line.
Basic MACD formula: MACD line = 12-period EMA – 26-period EMA. Signal line = 9-period EMA of the MACD line. Histogram = MACD line – signal line.
The 12/26/9 settings are defaults, not a universal quality filter. Shorter settings make the indicator more responsive and more exposed to noise. Longer settings make it smoother and slower. In both cases, the calculation remains historical because it uses prior price data as its input.
For the smoothing layer behind this comparison, the signal-line concept helps separate the raw indicator line from its smoothed reference line.
MACD Line, Signal Line, Histogram, and Zero Line
A MACD reading is clearer when its components are separated before interpretation. The line, signal line, histogram, and zero line do different jobs. Treating all four as one combined instruction is where many false readings start.
| MACD component | What it measures | How it is read | What can mislead it |
|---|---|---|---|
| MACD line | The difference between the shorter EMA and longer EMA. | Shows whether shorter-term average price behavior is above or below longer-term average behavior. | It can turn late after a sharp move because it is derived from moving averages. |
| Signal line | A smoothed average of the MACD line. | Creates a comparison point for changes in MACD momentum. | Frequent crosses can appear when momentum is unstable or range-bound. |
| Histogram | The distance between the MACD line and the signal line. | Shows expansion or contraction in the MACD-line versus signal-line spread. | Histogram expansion can look meaningful even when price structure remains unresolved. |
| Zero line | The point where the shorter EMA and longer EMA are equal. | Frames whether the MACD line is above or below the longer-term EMA relationship. | A zero-line move alone does not prove directional acceptance. |
The sequence matters. Read the MACD line and signal line relationship first, then check the histogram, then place that reading against the zero line and the broader market structure.
What a MACD Signal Line Cross Shows
A macd signal line cross occurs when the MACD line moves through the signal line. This shows that the MACD line has changed its relationship to its own smoothed average.
The cross can reflect a shift in relative momentum, but the cross by itself is thin evidence. A cross far from the zero line after a strong extension, a cross near the zero line during a range, and a cross that appears after a long directional move all carry different meanings.
The safer reading is relational: the MACD line is either gaining relative strength against the signal line or losing it. That does not make the cross predictive. It only shows that the smoothed momentum relationship has changed.
What MACD Histogram Expansion Adds
MACD histogram expansion shows that the distance between the MACD line and the signal line is increasing. Histogram contraction shows that the distance is narrowing.
This can add useful information after a signal-line cross because it shows whether the cross is being followed by wider separation or by immediate compression. A cross followed by expanding histogram bars has a different momentum profile from a cross that quickly flattens.
The limitation is that histogram expansion is not the same as clean trend acceptance. If price remains trapped in a range, a larger histogram bar can still be part of rotation rather than stable directional behavior. The separate MACD histogram reading carries more detail, while the core MACD reading still depends on the line, signal line, histogram, and zero-line relationship together.
Why MACD Zero-Line Context Matters
The zero line is the point where the shorter EMA and longer EMA relationship is balanced. When the MACD line is above zero, the shorter EMA is above the longer EMA. When the MACD line is below zero, the shorter EMA is below the longer EMA.
This macd zero-line context helps separate a crossover that happens inside neutral momentum from one that happens after the indicator has already moved into a stronger directional relationship. A crossover near the zero line often needs more caution because the moving-average spread may still be small.
Zero-line context should not be read as a standalone direction filter. It is a reference point for the EMA relationship, not proof that price has accepted a new trend structure.
When MACD Crossovers Become False Positives
A macd crossover false positive is more likely when MACD crosses repeatedly while price remains inside a sideways range. In that environment, the shorter EMA can move back and forth around the longer EMA without creating a stable momentum structure.
False-positive risk also rises when the cross happens very close to the zero line, when histogram expansion appears briefly and then contracts, or when price continues to rotate around the same area. The indicator may be reacting correctly to small changes in average price, but those changes may not be meaningful enough to support a stronger interpretation.
Interpretation limit: MACD can show that momentum is changing, but it cannot prove that the surrounding price structure has accepted that change. A crossover is weaker when it is quickly reversed, repeated several times, or unsupported by broader structure.
A common scenario is a sideways market where price rotates above and below its moving averages. MACD crosses the signal line several times, the histogram expands and contracts, and the zero-line distance remains small. In that case, the indicator is showing rotation more than accepted trend behavior.
Stronger vs Weaker MACD Readings
MACD becomes more useful when the line, signal line, histogram, and zero-line context point in the same general direction. It becomes weaker when those components conflict or when the indicator keeps resetting inside a narrow range.
| Reading condition | Stronger interpretation | Weaker interpretation |
|---|---|---|
| MACD line vs signal line | The relationship changes and then continues to widen. | The line crosses and quickly crosses back. |
| Histogram behavior | Bars expand after the cross and remain coherent. | Bars expand briefly, then flatten or reverse. |
| Zero-line distance | The reading develops with visible distance from the zero line. | The reading stays close to zero and keeps resetting. |
| Market condition | Price structure is directional enough for momentum readings to stay coherent. | Price rotates sideways and creates repeated crossovers. |
| Component agreement | Line relationship, histogram, and zero-line context support the same reading. | One component strengthens while another remains mixed or unstable. |
This is why MACD should be read as a sequence rather than as a single event. The line cross starts the observation. Histogram behavior tests whether separation is expanding. The zero line frames where the EMA relationship sits. Range conditions decide whether the reading is more likely to be structure or noise.
MACD Limitations
MACD has several limitations that matter for interpretation. The first is lag. Because MACD is built from moving averages, it usually responds after price has already changed. This can make the indicator slower near turning points and reactive during sharp moves.
The second limitation is range whipsaw. Sideways markets can create repeated signal-line crosses with little directional meaning. In that condition, MACD may keep reacting to short bursts of movement without identifying a stable momentum phase.
The third limitation is overreading divergence. Divergence can be a useful related concept, but it is not a complete reading by itself. A difference between price movement and MACD movement may reflect slowing momentum, but it still needs context before it carries much weight.
The fourth limitation is component isolation. A histogram bar, a zero-line move, or a signal-line cross can look clear on its own while the full MACD structure remains mixed.
MACD vs RSI
MACD and RSI both describe momentum, but they organize it differently. MACD is built from moving-average relationships. RSI compares the magnitude of recent gains and losses over a lookback period.
That distinction matters because MACD is often better framed as a trend-momentum relationship, while RSI is more directly tied to relative strength and momentum oscillation. A full MACD vs RSI comparison can handle that distinction without expanding the core MACD explanation into a broad indicator matchup.
MACD Strategy and Related Readings
MACD interpretation starts with the indicator’s calculation and component structure. A separate MACD strategy framework can address how MACD is combined with structure, confirmation, invalidation, and broader conditions.
The core MACD reading is narrower: read the calculation first, separate the components second, check the signal-line relationship third, add histogram and zero-line context fourth, then look for conditions that make the reading weaker.
FAQ
What is MACD?
MACD is a lagging momentum indicator that compares a shorter exponential moving average with a longer exponential moving average. It uses a MACD line, signal line, histogram, and zero line to show how the moving-average relationship is changing.
Is MACD a leading or lagging indicator?
MACD is a lagging indicator because it is calculated from historical price data through moving averages. It can describe momentum changes, but it does not predict future price movement.
What does the MACD histogram show?
The MACD histogram shows the distance between the MACD line and the signal line. Expanding bars show widening separation, while contracting bars show narrowing separation.
Why can MACD crossovers fail?
MACD crossovers can fail when price is moving sideways, when the crossover happens close to the zero line, or when the MACD line crosses the signal line repeatedly without stable follow-through in the broader structure.
How is MACD different from RSI?
MACD is based on the relationship between moving averages, while RSI compares recent gains and losses over a lookback period. Both can describe momentum, but they do not measure it in the same way.