MACD and RSI are both used to read momentum, but they do not measure the same thing. MACD compares moving-average relationships and shows whether momentum separation is widening, compressing, or crossing. RSI measures recent gain and loss pressure inside a bounded 0-100 oscillator.
The useful MACD vs RSI distinction is not which indicator is universally better. It is which type of momentum question each one answers. MACD is often the clearer lens for reading trend-following momentum structure, while RSI is often clearer when the question is whether recent pressure has become stretched, compressed, or divergent from price.
Quick difference between MACD and RSI
- MACD reads moving-average momentum. It focuses on the relationship between a faster moving average, a slower moving average, a signal line, and the histogram.
- RSI reads bounded pressure. It compares recent upward and downward movement and displays the result on a fixed 0-100 scale.
- MACD has no fixed upper or lower limit. Its value depends on price scale and moving-average separation.
- RSI is bounded. Its high and low zones can show stretched pressure, but they are not automatic action instructions.
- The same chart can make both indicators look active while each is describing a different part of momentum.
MACD vs RSI: the core difference
MACD and RSI overlap because both are momentum indicators. That shared label creates confusion: both can move during the same price swing, but they are not confirming the same measurement. MACD reads the distance and interaction between moving-average-based lines. RSI reads the balance of recent gains and losses inside a fixed oscillator range.
Core distinction: MACD answers, “Is moving-average momentum separating, compressing, or crossing?” RSI answers, “Is recent upward or downward pressure becoming stretched, fading, or diverging from price?”
This difference matters most when price is trending or stretching. A strong advance can keep MACD expanding because the moving-average relationship is still widening. The same advance can keep RSI elevated because recent gains continue to dominate recent losses. Those readings can happen together, but they are not identical.
How MACD reads momentum
MACD is built from moving-average relationships. Its main structure includes the MACD line, the signal line, the zero line, and often a histogram that visualizes the distance between the MACD line and the signal line.
The MACD histogram belongs to the MACD side of the comparison because it makes separation and compression easier to see. Expanding bars can show that the gap between the MACD line and signal line is widening. Contracting bars can show that the gap is narrowing. That does not make the histogram a standalone forecast; it only describes how the MACD structure is changing.
MACD is most useful as a structure lens. It becomes easier to interpret when the line relationship, histogram behavior, zero-line position, and price structure are all being read together.
MACD can lag because it is derived from moving averages. In choppy markets, the lines can compress and cross frequently without giving a clean interpretation. The safer reading is to treat MACD as a moving-average momentum map, not as an isolated instruction.
How RSI reads momentum
RSI is a bounded oscillator that compares recent gains with recent losses. Its scale runs from 0 to 100, which makes it easier to see when recent pressure is high, low, or returning toward the middle of the range.
RSI is often discussed through zones such as 70 and 30. Those levels are better understood as context zones, not automatic reversal points. In a strong trend, RSI can remain elevated or depressed longer than expected because recent pressure continues in the same direction.
RSI can mislead when threshold levels are read mechanically. A high RSI reading can show strong recent upward pressure, but it does not prove that pressure must reverse immediately. A low RSI reading can show strong recent downward pressure, but it does not prove that pressure has finished.
RSI is usually clearer when the question is about pressure, stretch, or divergence. It is less useful when the reader needs to understand the moving-average relationship behind a trend, because that is not what RSI is designed to show.
MACD vs RSI comparison table
| Comparison point | MACD | RSI |
|---|---|---|
| Calculation basis | Moving-average relationship between faster and slower averages, plus a signal-line comparison. | Recent gains versus recent losses, converted into a bounded oscillator reading. |
| Scale | Unbounded and centered around a zero-line context. | Bounded from 0 to 100. |
| Main diagnostic question | Is moving-average momentum separating, compressing, or crossing? | Is recent pressure stretched, fading, or diverging from price? |
| Strongest context | Trend development, momentum expansion, and line/histogram relationship. | Range behavior, pressure extremes, and momentum stretch. |
| Common misread | Reading every line interaction without checking price structure. | Reading high or low zones as automatic reversal evidence. |
| Failure condition | Can whipsaw when moving averages compress in noisy conditions. | Can stay elevated or depressed during persistent trends. |
| Safer interpretation | Use it to map momentum structure, then compare it with trend and price behavior. | Use it to judge pressure and stretch, then compare it with structure and context. |
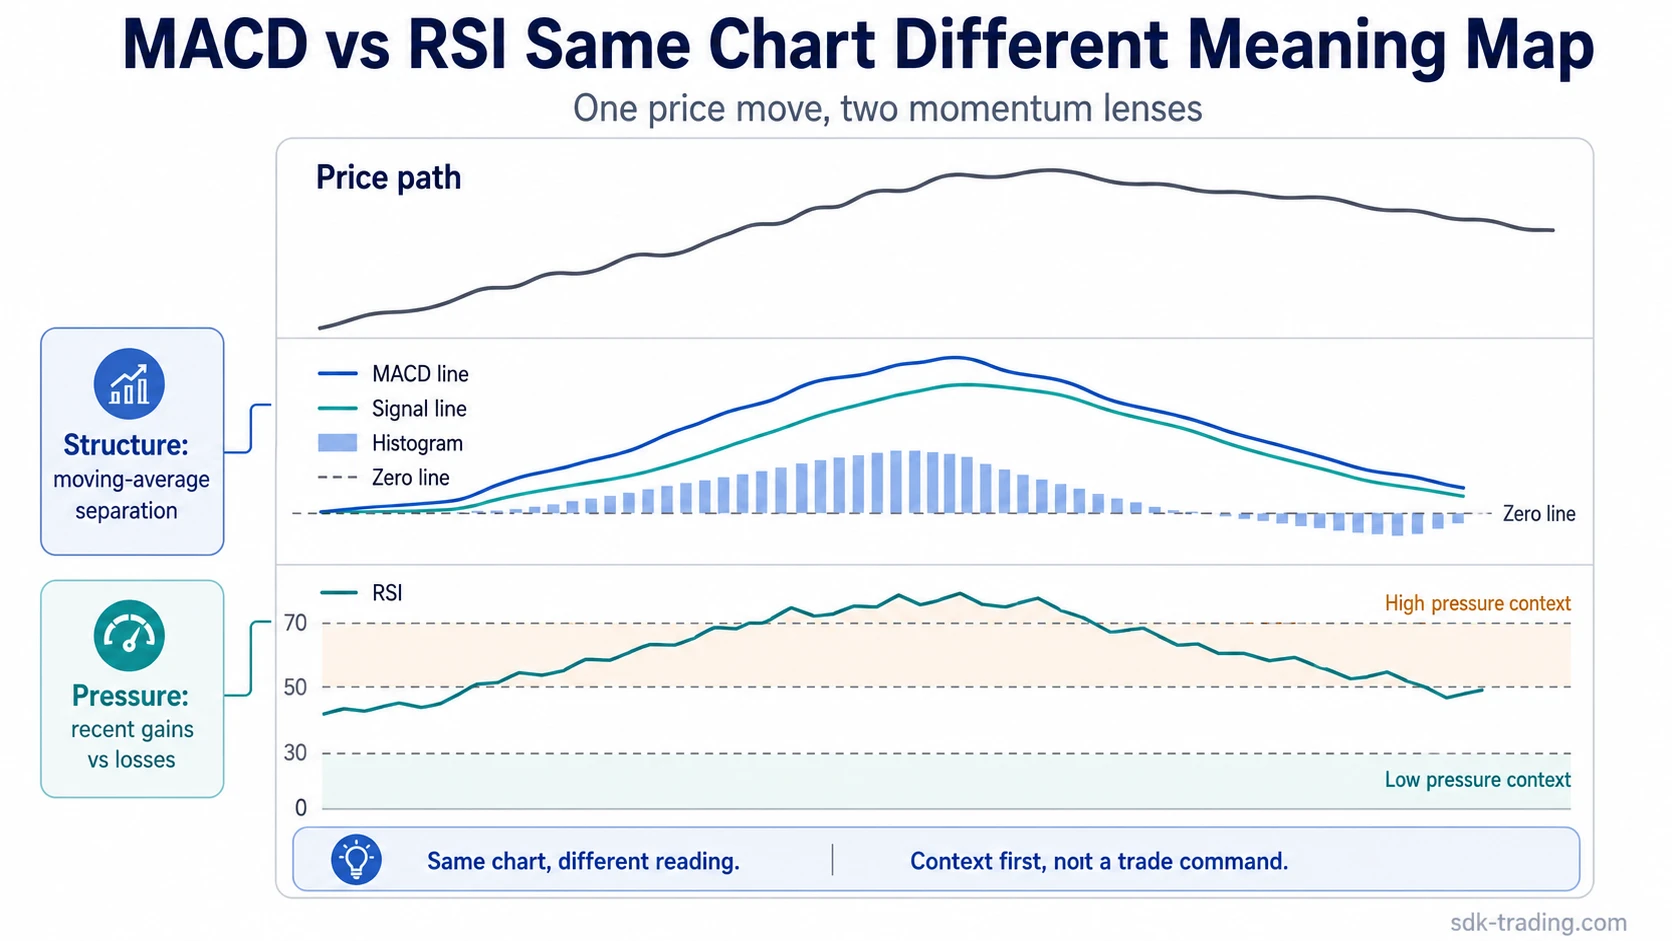
Same chart, different meaning
Consider an illustrative chart where price rises strongly for several sessions. MACD may show the MACD line above the signal line while histogram bars expand. RSI may remain near a high zone during the same movement.
Same movement, two readings: MACD can show that moving-average momentum separation is still widening. RSI can show that recent upward pressure is already stretched. The disagreement is informational, not a command.
The mistake is treating the two readings as duplicates. MACD is describing the structure of moving-average momentum. RSI is describing the intensity of recent gain/loss pressure. A strong chart can keep MACD momentum separation expanding while RSI already looks stretched, because each indicator is measuring a different relationship.
The same logic can work in the opposite direction. Price can fall while MACD remains weak because moving averages are still separating downward, while RSI begins to stabilize because recent downside pressure is no longer accelerating. That does not prove a reversal. It only shows that one lens is tracking trend structure while the other is tracking recent pressure.
When MACD or RSI may be easier to read
MACD is often easier to read when price has a cleaner directional structure. In that environment, the line relationship, histogram expansion or contraction, and zero-line position can help show whether momentum is building or fading inside the trend.
RSI is often easier to read when price is range-bound, stretched, or repeatedly failing to extend. Its bounded scale makes pressure easier to compare across swings, especially when the question is whether price is making progress with weaker or stronger recent momentum.
| Market context | MACD may be clearer when… | RSI may be clearer when… |
|---|---|---|
| Trending market | Moving-average separation, zero-line position, and histogram behavior align with price structure. | Pressure remains persistently high or low, showing that stretch can continue during a strong trend. |
| Range-bound market | Frequent compression and line interaction can make the reading noisy. | The 0-100 scale can make pressure shifts and repeated extremes easier to compare. |
| Choppy market | Moving-average relationships may flip often and need stronger context. | RSI may also fluctuate around the middle, reducing the value of threshold-based interpretation. |
| Momentum stretch | Can show whether the moving-average gap is still expanding or beginning to contract. | Can show whether recent pressure is stretched, fading, or diverging from price. |
Neither indicator solves market context by itself. MACD can be easier to read in one condition and RSI in another, but both become weaker when price structure is ignored.
Why MACD and RSI can disagree
MACD and RSI can disagree because one is moving-average-based and the other is pressure-based. MACD can remain strong after RSI has already reached a high zone. RSI can begin to diverge while MACD still reflects an established trend relationship.
Timeframe and settings can also change the reading. A shorter setting can make either indicator more reactive. A longer setting can smooth the reading but increase lag. The safer comparison is not “which setting is best,” but whether the indicator is answering the right question for the chart condition.
Common disagreement trap: assuming one indicator must be wrong when MACD and RSI do not match. They may simply be measuring different forms of momentum at different speeds.
When the two disagree, price structure should stay central. A reading becomes more useful when it lines up with trend quality, support and resistance behavior, range boundaries, volatility, and the broader structure around the move.
MACD divergence vs RSI divergence
MACD divergence and RSI divergence are related ideas, but they are not the same reading. MACD divergence compares price movement with moving-average momentum structure. RSI divergence compares price movement with bounded recent pressure.
For example, price can make a higher high while MACD shows weaker histogram or line behavior. That can indicate that moving-average momentum is not expanding as strongly as price. Price can also make a higher high while RSI makes a lower high. That can indicate that recent gain pressure is not keeping up with the price extension.
Divergence is a warning context, not a reversal guarantee. It can show that the quality of momentum is changing, but it should be read with price structure, volatility, and follow-through.
The distinction matters because MACD divergence and RSI divergence can appear at different times. A chart can show pressure divergence before moving-average momentum turns, or moving-average compression before RSI gives a clear pressure warning.
Common mistakes when comparing MACD and RSI
Treating both as interchangeable momentum indicators: The phrase “momentum indicator” is too broad to settle the comparison. MACD and RSI both relate to momentum, but one tracks moving-average relationships while the other tracks bounded recent pressure.
Reading RSI zones mechanically: RSI zones can help describe pressure, but they should not be treated as automatic reversal evidence. Strong trends can keep RSI high or low while price continues in the same direction.
Reading MACD line behavior without structure: MACD line interaction is easier to misread when price is choppy. Compression, crossing, and histogram contraction need context from price behavior rather than being treated as isolated events.
Using both as duplicate confirmation: Using MACD and RSI together can be useful only when each is assigned a different job. If both are treated as two versions of the same message, the comparison adds noise rather than clarity.
Ignoring timeframe sensitivity: A reading that looks stretched on one timeframe may look neutral on another. The indicator setting and the chart timeframe both affect how quickly the reading responds.
Can MACD and RSI be used together?
MACD and RSI can be used together as separate diagnostic lenses. MACD can describe moving-average momentum structure. RSI can describe bounded pressure and stretch. The combination is most useful when the two indicators are not forced to say the same thing.
Cleaner combined reading: MACD can ask whether trend momentum is widening or compressing, while RSI can ask whether recent pressure is stretched, fading, or diverging. The comparison remains about interpretation, not execution.
A weaker combined reading happens when every MACD change and every RSI threshold is treated as confirmation. That approach can double-count momentum instead of separating structure from pressure.
Which indicator fits the question better?
| Question | Cleaner first lens | Why |
|---|---|---|
| Is trend momentum expanding or compressing? | MACD | It is built around moving-average separation and signal-line relationship. |
| Is recent pressure stretched? | RSI | Its bounded scale makes high, low, and middle-zone pressure easier to compare. |
| Is a trend still structurally supported? | MACD, with price structure | Line relationship, histogram behavior, and zero-line context can help frame trend quality. |
| Is price making progress with weaker pressure? | RSI, with price structure | RSI divergence can show when recent pressure is not matching price extension. |
| Are both indicators saying the same thing? | Neither by default | The stronger question is whether each lens adds a different piece of information. |
MACD fits best when the main question is about trend momentum structure. RSI fits best when the main question is about bounded pressure and stretch. The cleanest reading starts with the question, not with a fixed preference for one indicator.
FAQ
Are MACD and RSI both momentum indicators?
Yes. Both relate to momentum, but they measure it differently. MACD reads moving-average momentum relationships, while RSI reads recent gain and loss pressure on a 0-100 scale.
Which is better, MACD or RSI?
Neither is universally better. MACD is often clearer for trend momentum structure, while RSI is often clearer for bounded pressure, stretch, and divergence.
Why can MACD and RSI disagree?
They can disagree because MACD is based on moving-average relationships and RSI is based on recent gain/loss pressure. A disagreement can show different information rather than a simple conflict.
Is MACD divergence the same as RSI divergence?
No. MACD divergence compares price with moving-average momentum structure. RSI divergence compares price with bounded recent pressure.
Can MACD and RSI be used together?
They can be used together when each has a separate role. MACD can map momentum structure, while RSI can show pressure and stretch. The comparison should not become a mechanical checklist.
Final interpretation
MACD vs RSI is best understood as structure versus pressure. MACD describes how moving-average momentum is separating, compressing, or crossing. RSI describes whether recent gain/loss pressure is high, low, fading, or diverging from price.
When both appear on the same chart, the strongest reading comes from separating their jobs instead of forcing them into one message.