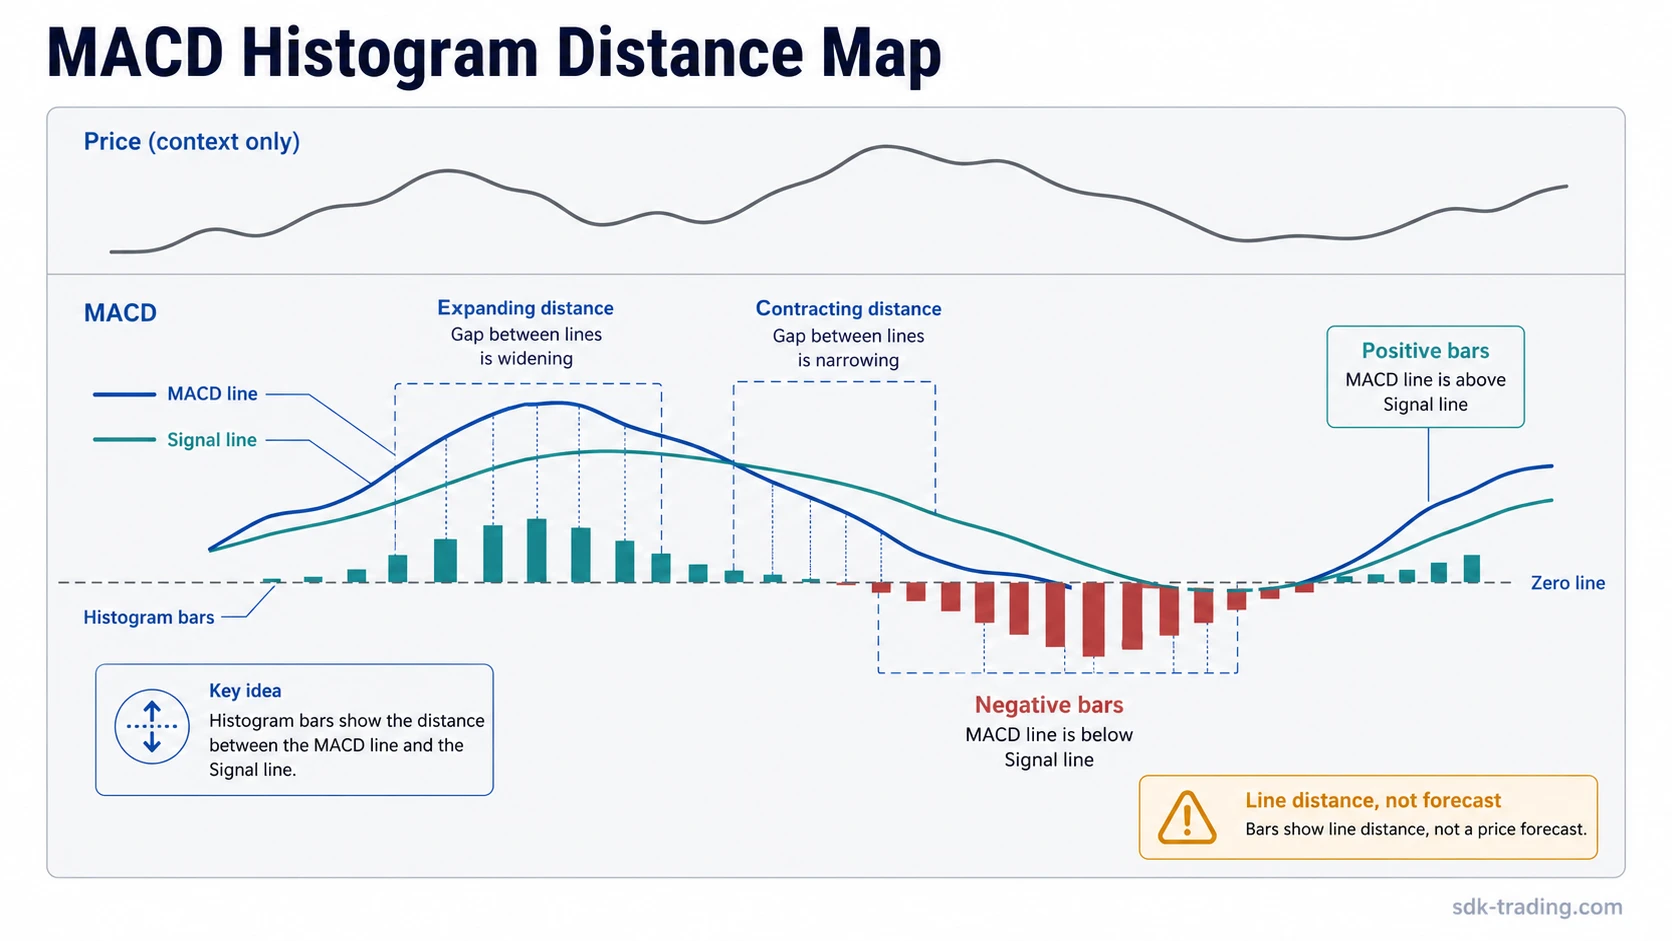
The MACD histogram measures the difference between the MACD line and the signal line. It turns that distance into vertical bars, so the reader can see when the relationship between the two lines is widening, narrowing, or crossing the zero line.
A positive bar means the MACD line is above the signal line. A negative bar means the MACD line is below the signal line. Expanding bars show that the gap is increasing, while contracting bars show that the gap is narrowing. The histogram is useful as a momentum-distance reading, but it is not a direct price forecast or a standalone decision tool.
Key Points
- What it measures: the distance between the MACD line and the signal line.
- Formula: MACD Histogram = MACD Line – Signal Line.
- Positive bars: the MACD line is above the signal line.
- Negative bars: the MACD line is below the signal line.
- Main limitation: small bars near zero can flip repeatedly during sideways price action.
What Is the MACD Histogram?
The MACD histogram is the bar component of the MACD indicator. It does not measure price directly. It measures the gap between the MACD line and the signal line, then displays that gap as bars above or below a zero line.
That makes the histogram a visual shortcut for reading the line relationship inside MACD. Instead of only watching two lines cross, the reader can see whether those lines are moving farther apart or closer together. This can make changes in momentum-distance easier to notice when the line relationship is shifting gradually.
The histogram should still be read as a derived indicator. The MACD line is based on moving averages, the signal line is a moving average of the MACD line, and the histogram is calculated from the difference between those two lines. That layered construction can be useful, but it can also lag or mislead when market structure is unclear.
MACD Histogram Formula
The standard MACD histogram formula uses the same default MACD settings found on many charting platforms:
MACD Line = 12-period EMA – 26-period EMA
Signal Line = 9-period EMA of the MACD Line
MACD Histogram = MACD Line – Signal Line
The exact periods can vary by platform or user setting, but the structure is the same: the histogram is the difference between the MACD line and its signal line. If the MACD line is above the signal line, the histogram is positive. If the MACD line is below the signal line, the histogram is negative.
This is why the zero line matters. A histogram cross through zero happens when the MACD line and signal line cross each other. The zero line is not a separate price level. It is the point where the difference between those two lines becomes zero.
How to Read MACD Histogram Bars
MACD histogram bars are usually read through four basic conditions: positive bars, negative bars, expanding bars, and contracting bars. Each condition describes the relationship between the MACD line and the signal line, not a guaranteed future price move.
| Histogram condition | What it means mechanically | Safer interpretation |
|---|---|---|
| Positive bars | The MACD line is above the signal line. | Momentum-distance is positive, but price structure still matters. |
| Negative bars | The MACD line is below the signal line. | Momentum-distance is negative, but this does not prove continuation. |
| Expanding bars | The gap between the MACD line and signal line is widening. | The move may be gaining momentum-distance if price supports the reading. |
| Contracting bars | The gap between the MACD line and signal line is narrowing. | Momentum-distance may be fading, but reversal is not proven. |
| Zero-line cross | The MACD line and signal line have crossed. | The line relationship changed, but the reading can be weak in choppy conditions. |
The practical question is not whether one bar changed color. The better question is whether the bars show separation, convergence, or repeated instability around zero. That distance-based view keeps the reading tied to the indicator’s actual construction.
What Expanding and Contracting Bars Mean
Expanding MACD histogram bars mean the MACD line and signal line are moving farther apart. If the bars are above zero and growing taller, the MACD line is moving farther above the signal line. If the bars are below zero and growing deeper, the MACD line is moving farther below the signal line.
Contracting bars mean the gap between the two lines is shrinking. Above zero, shorter bars mean the MACD line is still above the signal line, but with less separation. Below zero, shorter bars mean the MACD line is still below the signal line, but the gap is narrowing.
This distinction matters because a contracting positive histogram is not the same thing as a negative histogram. It means positive distance is narrowing. A contracting negative histogram is not the same thing as a positive histogram. It means negative distance is narrowing. The zero-line cross occurs only when the MACD line and signal line meet and the difference moves through zero.
Reading the histogram as distance, not prediction: The MACD histogram is strongest as a distance map. It can show whether the MACD line and signal line are separating or converging, but it does not prove what price must do next. The reading becomes more useful when price structure, trend context, and volatility conditions support the same interpretation.
When MACD Histogram Readings Become Weak
MACD histogram readings become weaker when the bars are small, unstable, and clustered near the zero line. In that condition, the MACD line and signal line are very close together. Small changes can make the histogram flip from positive to negative without showing a durable shift in market behavior.
Sideways price action is one of the most common weak environments. When price compresses in a narrow range, the MACD line and signal line may cross repeatedly. The histogram may alternate above and below zero, but the bars often stay small. That creates a noisy reading rather than a clean momentum-distance message.
A common weak-reading scenario is a narrow range where price keeps rejecting both sides of the range while the histogram flips just above and below zero. The bars may look active, but the MACD line and signal line are still close together, so the histogram is describing instability rather than a clear momentum-distance shift.
The reading also weakens when the histogram conflicts with price structure. For example, expanding bars may look stronger on the indicator panel, but if price is still trapped below a major resistance area or failing to hold acceptance after a move, the histogram alone is not enough to resolve the situation.
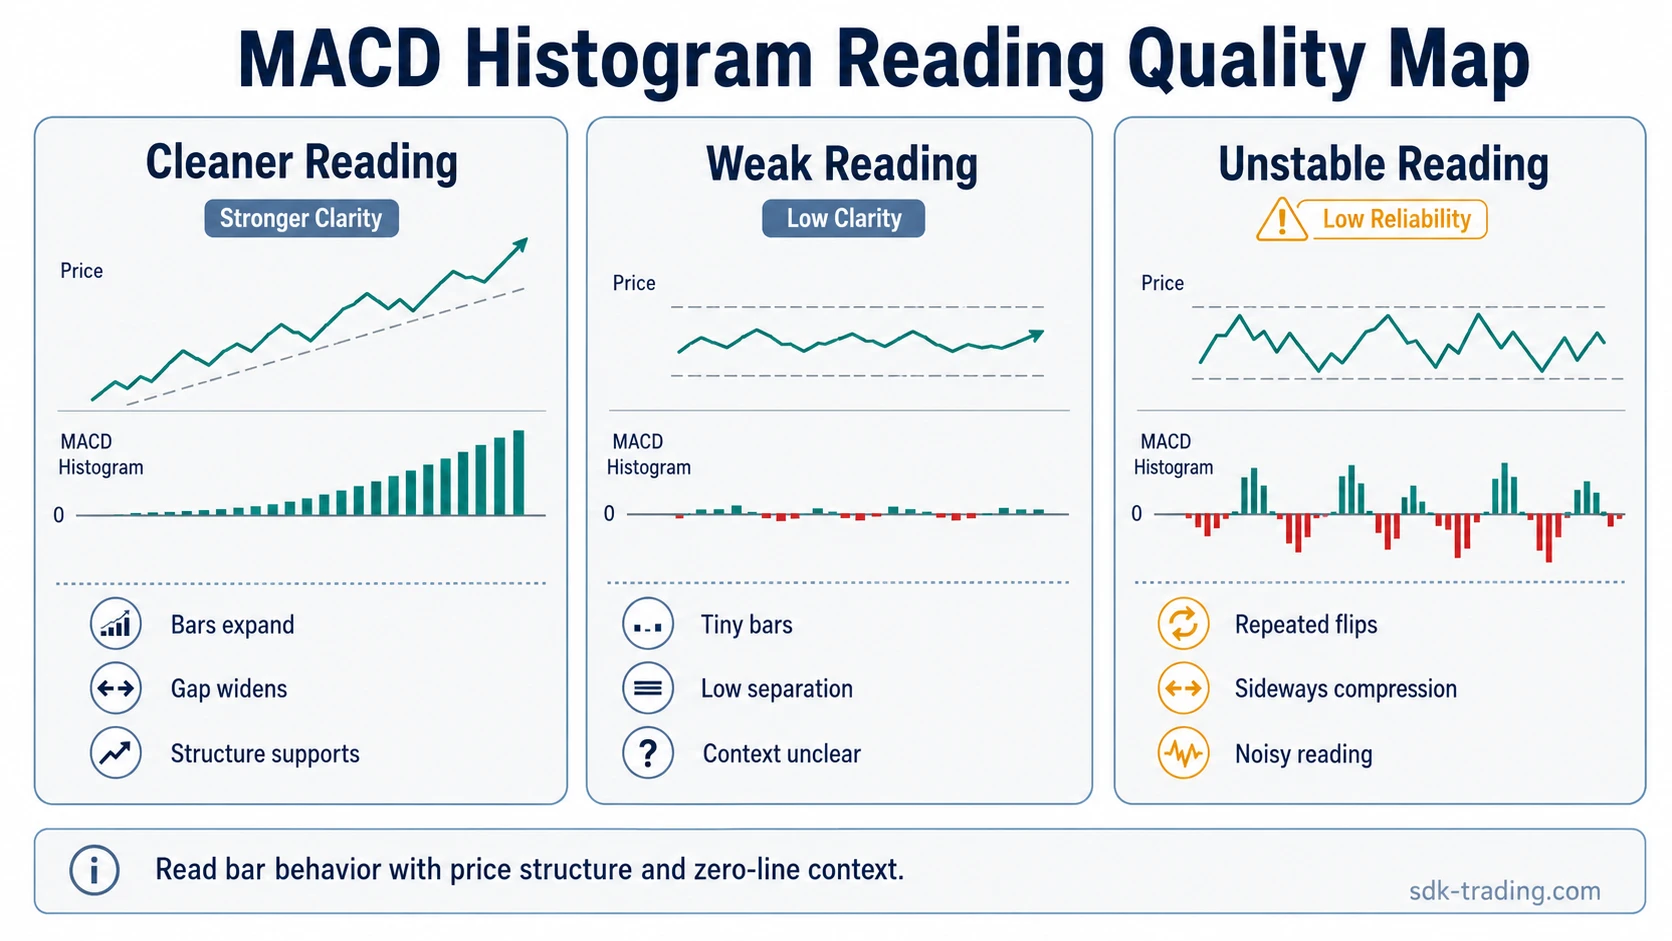
- Tiny bars near zero show that the MACD line and signal line are very close together.
- Repeated zero-line flips show an unstable line relationship, often during sideways compression.
- Sideways price structure can produce many small MACD crosses without directional clarity.
- Indicator-price conflict weakens the reading when the histogram improves but price structure remains unresolved.
MACD Histogram vs MACD Line and Signal Line
The MACD histogram is not separate from MACD. It is one way to display the relationship between the MACD line and the signal line. The broader MACD indicator includes the line construction, the signal line, and the histogram together.
The MACD line shows the difference between two moving averages. The signal line smooths the MACD line. The histogram then shows the difference between those two lines. This makes the histogram useful for reading the line relationship quickly, but it should not replace the full MACD context.
| Component | What it shows | How it relates to the histogram |
|---|---|---|
| MACD line | The difference between the fast and slow EMAs. | The histogram compares this line against the signal line. |
| Signal line | A smoothing line based on the MACD line. | The histogram turns the gap between the two lines into bars. |
| Histogram | The MACD line minus the signal line. | It visualizes expansion, contraction, and zero-line crosses. |
MACD Histogram Divergence
MACD histogram divergence happens when price and the histogram move in different directions. For example, price may push to a higher high while the histogram forms a lower high, or price may make a lower low while the histogram forms a higher low.
Divergence can warn that momentum-distance is changing before price fully reflects that change. It should not be treated as reversal proof. Short, shallow, or isolated divergence can appear during normal trend pauses, especially when the histogram is already near zero.
A stronger divergence reading usually needs more than the histogram itself. The surrounding price structure should show that the market is accepting the change rather than immediately rejecting it. Without that context, divergence is only a warning condition, not a completed interpretation.
MACD Histogram Reading Quality Boundary
The MACD histogram becomes more useful when the bars, zero-line position, and price structure are all telling a similar story. It becomes less useful when those elements conflict or when the histogram is too compressed to carry much information.
| Reading condition | What it can suggest | What weakens it |
|---|---|---|
| Bars expanding away from zero | The MACD line and signal line are separating. | Price structure does not support the move. |
| Bars contracting toward zero | Momentum-distance is narrowing. | Bars are tiny and unstable around zero. |
| Repeated zero-line flips | The MACD/signal relationship is unstable. | Sideways compression dominates the chart. |
| Divergence | Momentum may be changing before price fully reflects it. | Divergence is shallow, short, or unsupported by later price acceptance. |
This boundary keeps the histogram from being read as a mechanical instruction. A clean reading does not require perfection, but it should show more than one small bar change. A weak reading often comes from trying to force meaning out of a compressed indicator panel before the price structure has clarified.
Common MACD Histogram Mistakes
Reading histogram bars as direct price forecasts: The histogram does not forecast price directly. It shows the relationship between the MACD line and the signal line. Price can continue, pause, reverse, or compress even while the histogram changes shape.
Treating a zero-line cross as automatic confirmation: A zero-line cross only means the MACD line and signal line have crossed. In a clean trend, that can be useful context. In sideways conditions, the same cross can appear repeatedly with little informational value.
Ignoring the size of the bars: Small bars near zero often show that the MACD line and signal line are close together. The smaller and more unstable the bars are, the easier it is for the histogram to flip without a meaningful change in structure.
Overvaluing short divergence: Divergence can be useful, but short or shallow divergence is easy to overread. A divergence reading becomes weaker when price does not later accept the change that the histogram appeared to warn about.
Practical Reading Framework
A practical way to use the MACD histogram is to separate clean, weak, and unreliable readings before assigning meaning to the bars.
- Cleaner reading: bars expand away from zero while price structure supports the move.
- Weak reading: bars contract, shrink, or hover close to zero.
- Unreliable reading: bars flip repeatedly around zero during sideways compression.
This framework does not turn the histogram into a standalone method. It simply makes the reading more disciplined: first understand what the bars measure, then check whether the surrounding chart gives the histogram enough context to matter.
FAQ
What does the MACD histogram show?
The MACD histogram shows the difference between the MACD line and the signal line. Positive bars mean the MACD line is above the signal line, while negative bars mean it is below the signal line.
Is the MACD histogram the same as MACD?
No. The MACD histogram is one component of MACD. MACD also includes the MACD line and the signal line, while the histogram displays the distance between those two lines.
Why can MACD histogram readings be misleading?
MACD histogram readings can be misleading when bars are small, unstable, and close to zero. In sideways price action, the histogram can flip repeatedly without showing a clear or durable change in structure.