The RSI indicator, or Relative Strength Index, is a bounded momentum oscillator that compares recent gains and losses to show the speed and magnitude of price movement on a 0-100 scale.
Definition: RSI measures momentum by comparing average gains with average losses over a selected lookback period. High readings show stronger upside momentum pressure, while low readings show stronger downside momentum pressure.
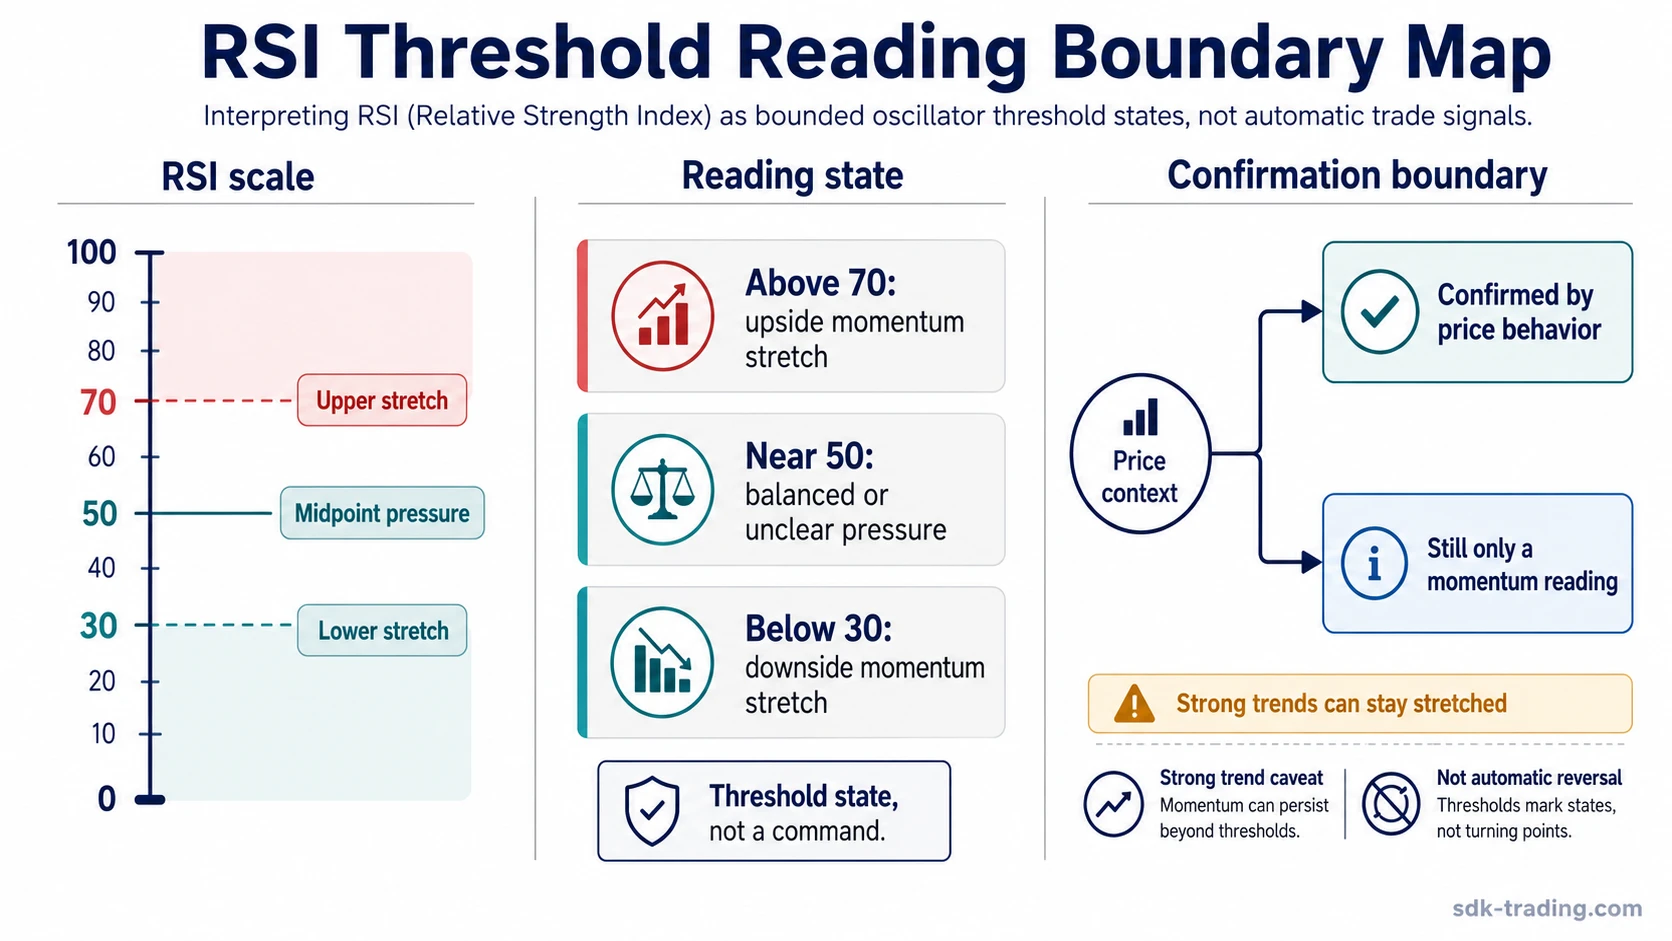
RSI readings are commonly watched around 70, 50, and 30, but those levels are reference zones rather than trade commands. A reading above 70 does not prove a bearish reversal, and a reading below 30 does not prove a bullish reversal. The stronger interpretation comes from whether price accepts, rejects, or fails to respond to the oscillator reading.
Key Points
- The RSI indicator measures momentum by comparing recent average gains with recent average losses.
- RSI is bounded between 0 and 100, which makes threshold zones easier to read than unbounded oscillators.
- Readings above 70 usually show an upper momentum stretch, while readings below 30 usually show a lower momentum stretch.
- The 50 line can help separate positive and negative momentum pressure.
- RSI divergence, range shifts, and failure swings need market structure confirmation before they carry strong weight.
What Is the RSI Indicator?
The RSI indicator is a technical-analysis oscillator developed by J. Welles Wilder. It compares the strength of recent upward closes with the strength of recent downward closes and converts that relationship into a fixed 0-100 reading.
The main role of RSI is to describe momentum pressure. When recent gains dominate the lookback period, RSI rises. When recent losses dominate, RSI falls. When buying and selling pressure are more balanced, RSI tends to move closer to the middle of the scale.
The fixed scale makes RSI easy to read, but it also creates a common mistake. The oscillator can show that momentum is stretched without proving that price must reverse. A threshold reading starts the interpretation; it does not finish it.
What RSI Measures
RSI measures the balance between recent upward and downward price movement. It does not measure volume, order flow, earnings, or news. It translates recent closing-price behavior into a momentum reading.
A rising RSI usually means recent gains are stronger than recent losses. A falling RSI usually means recent losses are stronger than recent gains. A flat or midpoint-heavy RSI often means momentum pressure is more balanced or unclear.
Reading boundary: RSI shows momentum pressure. It does not confirm a reversal, continuation, entry, exit, or profitable outcome by itself.
How the RSI Formula Works
The RSI formula starts by comparing average gains with average losses over a selected lookback period. The default setting is commonly 14 periods, although the reading changes when the lookback is shortened or lengthened.
| Formula part | What it means | Why it matters |
|---|---|---|
| Average Gain | The average size of upward price changes over the lookback period. | Shows how much upside pressure has appeared recently. |
| Average Loss | The average size of downward price changes over the lookback period. | Shows how much downside pressure has appeared recently. |
| Relative Strength | Average Gain divided by Average Loss. | Compares upward pressure with downward pressure. |
| RSI value | The relative-strength result converted into a 0-100 oscillator scale. | Creates a bounded momentum reading that can be compared with threshold zones. |
Formula: RS = Average Gain / Average Loss
RSI: RSI = 100 – [100 / (1 + RS)]
The formula explains why RSI reacts to both direction and speed. A slow advance may keep RSI near the middle of the scale, while a sharp sequence of gains can push it toward the upper zone. The same logic applies when losses dominate the lookback window.
How to Read RSI Thresholds
RSI values are usually interpreted around three important reference areas: the upper threshold near 70, the midpoint near 50, and the lower threshold near 30. These areas describe momentum conditions, not complete decisions.
| RSI area | Basic reading | Safer interpretation | What it does not prove |
|---|---|---|---|
| Above 70 | Upside momentum is stretched or unusually strong. | Read as an upper momentum stretch that needs context. | It does not prove bearish reversal. |
| Around 50 | Momentum is near the balance area between positive and negative pressure. | Read as a midpoint context clue, especially if RSI repeatedly holds above or below it. | It does not prove a full trend change. |
| Below 30 | Downside momentum is stretched or unusually strong. | Read as a lower momentum stretch that needs context. | It does not prove bullish reversal. |
| 80 / 20 adjusted context | Some strong trends push RSI into more extreme operating bands. | Read as a possible trend-persistence clue when price continues accepting new levels. | It does not prove that the move is safe, late, or finished. |
The 70 and 30 thresholds are common reference levels, but they are not universal reversal points. In strong trends, RSI can stay elevated or depressed for longer than expected. The 50 line can help show whether the oscillator is spending more time in positive or negative territory.
RSI Threshold Reading Boundary
A stronger RSI interpretation separates the oscillator value from the market behavior around it. The threshold shows the condition; follow-through decides whether the condition gains meaning.
| RSI observation | What it can show | What it does not confirm | What strengthens the reading | What weakens it |
|---|---|---|---|---|
| RSI moves above 70 | Upside momentum is stretched or strong. | A bearish reversal. | Price rejection, failed higher high, weakening momentum, or bearish divergence near structure. | Price keeps accepting higher levels while RSI remains elevated. |
| RSI drops below 30 | Downside momentum is stretched or strong. | A bullish reversal. | Price stabilization, failed lower low, improving momentum, or bullish divergence near structure. | Price keeps accepting lower levels while RSI remains depressed. |
| RSI holds above 50 | Positive momentum remains active. | Trend continuation. | Price holds higher lows or reclaims a prior resistance area. | Price breaks structure while RSI slips back below 50. |
| RSI stays below 50 | Negative momentum remains active. | Trend continuation. | Price fails near resistance and RSI rolls over from the midpoint. | Price reclaims structure while RSI pushes back above 50. |
| RSI diverges from price | Momentum is not confirming the latest price extreme. | Immediate reversal. | Divergence appears near a structural boundary and price confirms the loss of momentum. | Price continues in trend and RSI resets without structural change. |
| RSI forms a failure swing | The oscillator failed to sustain its prior extreme sequence. | A complete price reversal. | Price confirms the oscillator shift with a structure break or failed retest. | The oscillator sequence changes but price does not respond. |
This boundary approach keeps RSI in its proper role. The indicator can highlight momentum pressure, but it cannot confirm a full market decision without price behavior around the reading.
RSI in Ranges and Strong Trends
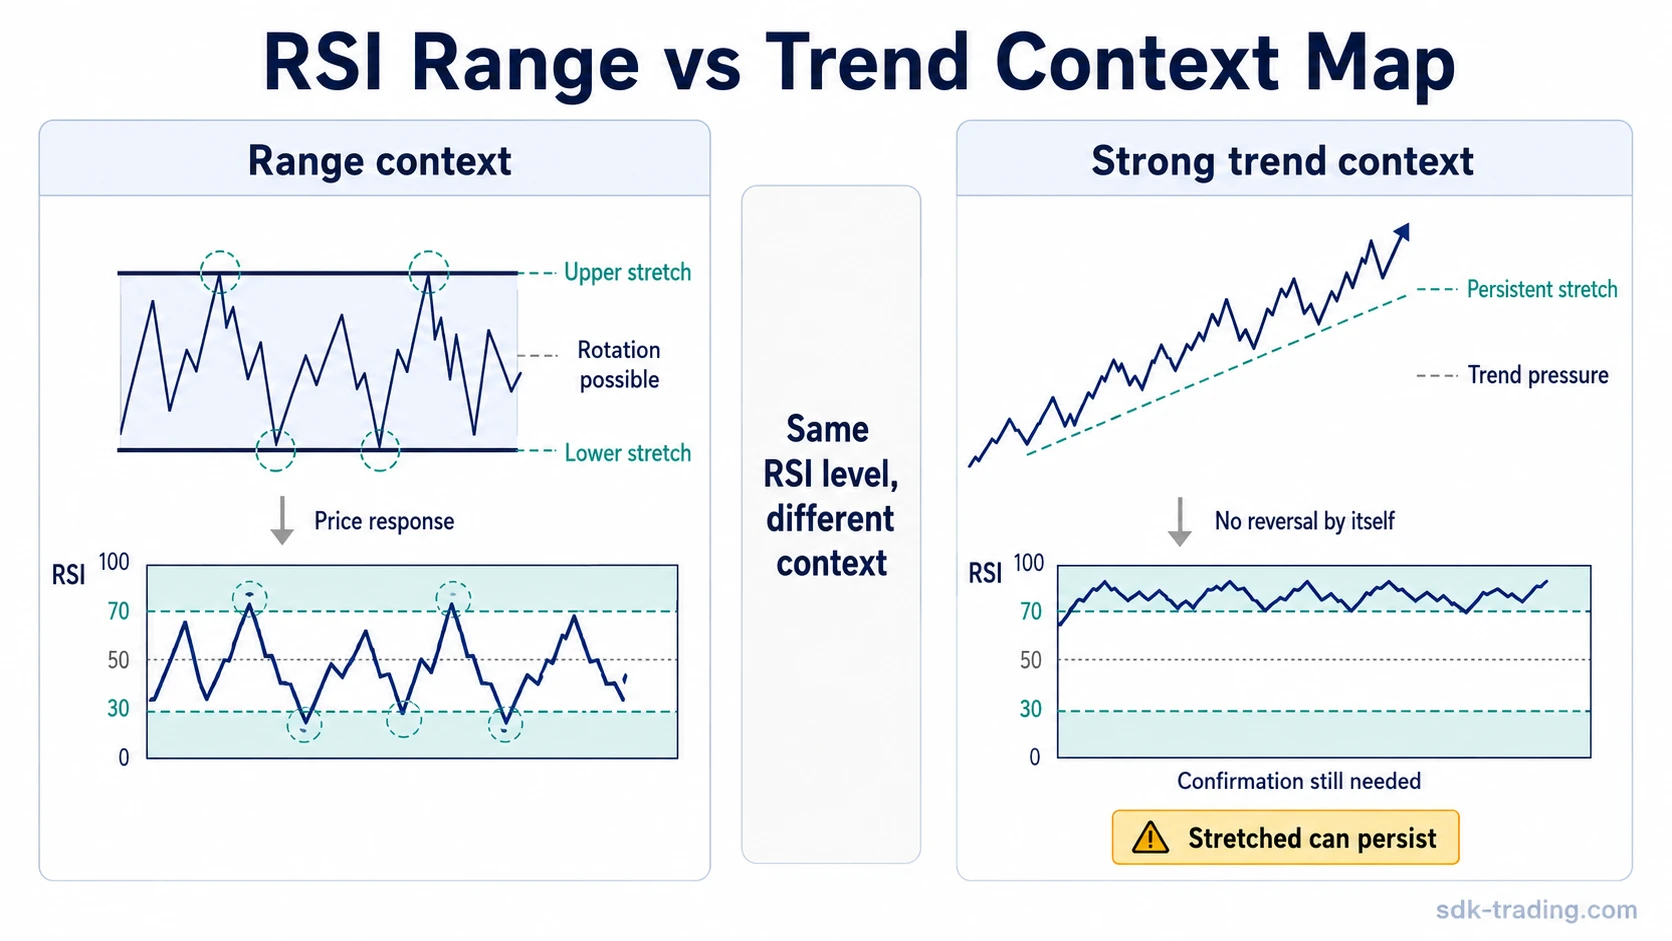
RSI behaves differently in range-bound markets and persistent trends. The same oscillator reading can mean different things depending on whether price is rotating inside a range or accepting new levels in a trend.
| Market context | How RSI often behaves | Safer interpretation |
|---|---|---|
| Range-bound market | RSI may rotate between upper and lower threshold zones as price moves between range boundaries. | Threshold readings carry more context when they align with price reaction at range support or resistance. |
| Strong uptrend | RSI can remain elevated and hold above the midpoint during pullbacks. | An overbought reading may describe trend strength rather than immediate exhaustion. |
| Strong downtrend | RSI can remain depressed and fail near the midpoint during bounces. | An oversold reading may describe persistent downside pressure rather than immediate recovery. |
| Choppy market | RSI may cross back and forth around 50 without a clean threshold sequence. | The oscillator may be describing noise rather than a useful momentum condition. |
In a range, an RSI stretch near a price boundary can be useful because the oscillator and structure are testing the same idea. In a strong trend, the same stretch can persist. The difference is not the RSI number alone; it is whether price accepts or rejects the area while RSI is stretched.
RSI Range Shift
An RSI range shift happens when the oscillator begins operating in a different band. Instead of moving evenly between overbought and oversold zones, RSI may start holding higher lows, failing at lower highs, or spending more time above or below the midpoint.
| RSI behavior | Possible context | Boundary |
|---|---|---|
| RSI repeatedly holds above 40-50 | Momentum may be shifting into a stronger bullish operating range. | Needs price structure to confirm that buyers are still defending pullbacks. |
| RSI repeatedly fails below 50-60 | Momentum may be shifting into a weaker bearish operating range. | Needs price structure to confirm that sellers are still controlling bounces. |
| RSI moves cleanly from lower range to upper range | Momentum pressure may be improving. | Still needs price acceptance, not only an oscillator move. |
| RSI loses the midpoint after holding above it | Positive momentum may be weakening. | The reading matters more if price also loses a meaningful structure area. |
Range shifts can be useful because they focus on RSI behavior over a sequence, not one isolated print. The main risk is reading the shift too early, before price confirms that the operating environment has changed.
RSI Divergence
RSI divergence appears when price makes a new extreme but RSI does not confirm that extreme. Bullish divergence usually means price makes a lower low while RSI makes a higher low. Bearish divergence usually means price makes a higher high while RSI makes a lower high.
| Divergence type | Basic pattern | What it can suggest | Confirmation boundary |
|---|---|---|---|
| Bullish RSI divergence | Price makes a lower low while RSI makes a higher low. | Downside momentum is weakening. | Needs price stabilization, failed downside follow-through, or a structure reclaim. |
| Bearish RSI divergence | Price makes a higher high while RSI makes a lower high. | Upside momentum is weakening. | Needs price rejection, failed upside follow-through, or a structure loss. |
| Hidden bullish divergence | Price holds a higher low while RSI makes a lower low. | Pullback pressure may be resetting within an uptrend. | Needs price to defend structure and resume acceptance higher. |
| Hidden bearish divergence | Price holds a lower high while RSI makes a higher high. | Bounce pressure may be resetting within a downtrend. | Needs price to reject structure and resume acceptance lower. |
Divergence is often useful as a warning, not as a final signal. It shows that momentum and price are no longer moving together cleanly, but the market still needs to confirm whether that disagreement matters.
RSI Failure Swing
An RSI failure swing is an oscillator pattern where RSI fails to sustain a prior extreme and then breaks its own recent swing point. Traders watch it because it can show a shift in momentum pressure before the price chart fully resolves.
| Failure swing type | Oscillator sequence | What it can suggest | What still matters |
|---|---|---|---|
| Bullish failure swing | RSI moves below 30, rebounds, pulls back without making a new low, then breaks the prior RSI rebound high. | Downside momentum may be weakening. | Price still needs to confirm that sellers are losing control. |
| Bearish failure swing | RSI moves above 70, pulls back, rebounds without making a new high, then breaks the prior RSI pullback low. | Upside momentum may be weakening. | Price still needs to confirm that buyers are losing control. |
A failure swing is cleaner when it appears near a price area that already matters. Without price confirmation, it remains an oscillator event rather than a complete market signal.
Clean, Weak, and Invalid RSI Readings
RSI becomes more useful when the reading is classified instead of treated as automatically valid. A clean reading has both oscillator evidence and price-context support. A weak reading has an oscillator condition but little response from price. An invalid reading forces a conclusion that the market has not confirmed.
| Reading quality | What it looks like | Interpretation | Failure condition |
|---|---|---|---|
| Clean RSI reading | RSI reaches a meaningful threshold while price also reacts near a relevant structure area. | The oscillator and price context are pointing toward the same pressure change. | The reading weakens if price fails to confirm the expected shift. |
| Weak RSI reading | RSI reaches a threshold, but price does not respond clearly. | The oscillator shows pressure, but the move is not accepted or rejected strongly enough. | The reading weakens if RSI resets while price stays unchanged or continues in trend. |
| Invalid RSI reading | A threshold is treated as a full signal against a strong trend or without price confirmation. | The reading becomes a false-positive risk because context does not support the interpretation. | The reading fails if price continues accepting new levels against the expected reversal. |
Common mistake: Treating overbought as automatically bearish or oversold as automatically bullish removes the context that RSI needs. A stretched reading can be the beginning of exhaustion, but it can also be a normal feature of a strong trend.
RSI Limitations
RSI is useful because it compresses momentum into a simple scale, but that simplicity also creates limits. The indicator is based on price behavior over a lookback period, so it can lag, reset, or stay stretched while price continues moving.
| Limitation | Why it matters | Safer handling |
|---|---|---|
| Lag | RSI uses prior price changes, so the reading can react after part of the move has already happened. | Use it as a momentum context tool, not as a timing guarantee. |
| False positives | Threshold readings can appear without a meaningful price reaction. | Check whether the move is accepted or rejected by price. |
| Trend persistence | RSI can stay overbought in strong uptrends or oversold in strong downtrends. | Read extreme values with trend context instead of assuming immediate reversal. |
| Bounded saturation | The 0-100 scale can compress very strong momentum near an extreme. | Compare the reading with price behavior and recent RSI sequences. |
| Price-only input | RSI does not include volume or broader market context. | Use it alongside structure, trend, and related evidence. |
| Standalone-signal risk | A single RSI reading can look decisive while the market remains unresolved. | Separate the oscillator condition from the final interpretation. |
RSI vs Nearby Oscillators
RSI belongs to the oscillator family, but nearby indicators measure different relationships. The distinction matters because two oscillators can look similar while describing different inputs.
| Oscillator | Main input logic | How it differs from RSI |
|---|---|---|
| Stochastic oscillator | Compares the close with the recent high-low range. | Focuses on where price closes inside a range, not average gains versus average losses. |
| Stochastic RSI | Applies stochastic logic to RSI values. | Usually reacts faster because it measures RSI’s position inside its own recent range. |
| Money Flow Index | Combines price movement with volume-weighted money flow. | Adds volume input, while RSI is based on price changes. |
| Rate of Change | Measures percentage change over a lookback period. | Shows direct price change rather than a bounded average-gain versus average-loss relationship. |
These differences do not make one oscillator universally better than another. They change what the reading describes and what kind of confirmation is needed.
RSI False-Signal Example
Consider a strong uptrend where RSI moves above 70 and remains elevated while price keeps forming higher highs and higher lows. The weak interpretation is to assume that overbought automatically means reversal. The safer reading is that RSI is showing stretched upside momentum, while price has not yet rejected the trend.
The interpretation changes only if momentum weakens and price behavior confirms that the trend is losing acceptance. Without that follow-through, RSI may be describing trend strength rather than exhaustion.
RSI FAQ
What does RSI measure?
RSI measures momentum by comparing recent average gains with recent average losses. It converts that relationship into a bounded 0-100 reading.
Is RSI above 70 a sell signal?
No. RSI above 70 usually shows an upper momentum stretch, not an automatic sell signal. Price can keep rising while RSI stays elevated, so the reading needs price structure and confirmation before it can support a bearish interpretation.
Is RSI below 30 a buy signal?
No. RSI below 30 usually shows a lower momentum stretch, not an automatic buy signal. Price can keep falling while RSI stays depressed, so the reading becomes stronger only when price behavior confirms that downside pressure is weakening.
Can RSI stay overbought or oversold?
Yes. RSI can stay overbought during strong uptrends and oversold during strong downtrends. Persistent threshold readings often describe trend strength rather than immediate reversal.
What is the difference between RSI and stochastic RSI?
RSI measures recent gains versus recent losses. Stochastic RSI applies stochastic logic to RSI values, so it is usually more sensitive and can produce more frequent oscillator turns.