A MACD strategy is a structured way to read momentum changes by checking the MACD line, signal line, histogram, zero line, and price context together. The strongest reading does not come from one crossover alone. It comes from the order of evidence: zero-line context first, line relationship second, histogram behavior third, price structure fourth, and failure checks last.
MACD works better as an interpretation framework than as a trade instruction system. A crossover can be useful information, but it becomes weaker when the indicator is clustered near the zero line, the histogram does not expand, or price remains trapped in a range.
Key Points
- A MACD strategy reads component agreement, not a single indicator event.
- The zero line helps separate stronger directional context from weaker equilibrium noise.
- Histogram expansion or contraction can support or weaken a line crossover.
- Repeated crosses near the zero line often point to poor signal quality rather than clean momentum change.
- Settings change sensitivity, but they do not remove lag, whipsaws, or range-market weakness.
What Is a MACD Strategy?
A MACD strategy is a conditional process for reading momentum shifts with the MACD indicator. It compares a faster moving average relationship with a slower one, then shows that relationship through the MACD line, signal line, histogram, and zero-line position.
The strategic question is different from the indicator definition. The indicator shows a calculated relationship based on historical price data. The strategy asks whether the parts agree strongly enough to support an interpretation, or whether the reading should be downgraded because the evidence is mixed.
Working definition: a MACD strategy is a sequence for reading momentum, trend context, and failure conditions together before giving weight to a crossover, histogram shift, zero-line move, or divergence.
The MACD Strategy Sequence
The sequence matters because MACD can produce frequent crosses when price is moving sideways or when momentum is unstable. Reading the components in order reduces the risk of treating every line interaction as equally meaningful.
| Step | Question to Ask | Weak Condition |
|---|---|---|
| 1. Zero-line context | Is MACD above, below, or clustered around the zero line? | Repeated movement around zero suggests equilibrium rather than clean directional pressure. |
| 2. Line relationship | Is the MACD line separating from or compressing toward the signal line? | A small crossover with little separation is easier to reverse. |
| 3. Histogram behavior | Is the histogram expanding, contracting, or flipping without follow-through? | A flat or contracting histogram weakens the crossover reading. |
| 4. Price structure | Is price trending, ranging, compressing, or breaking structure? | A range can create repeated indicator shifts without durable movement. |
| 5. Failure checks | Are crosses repeating near zero, arriving late, or conflicting with market structure? | Whipsaws, lag, and conflicting components should downgrade the interpretation. |
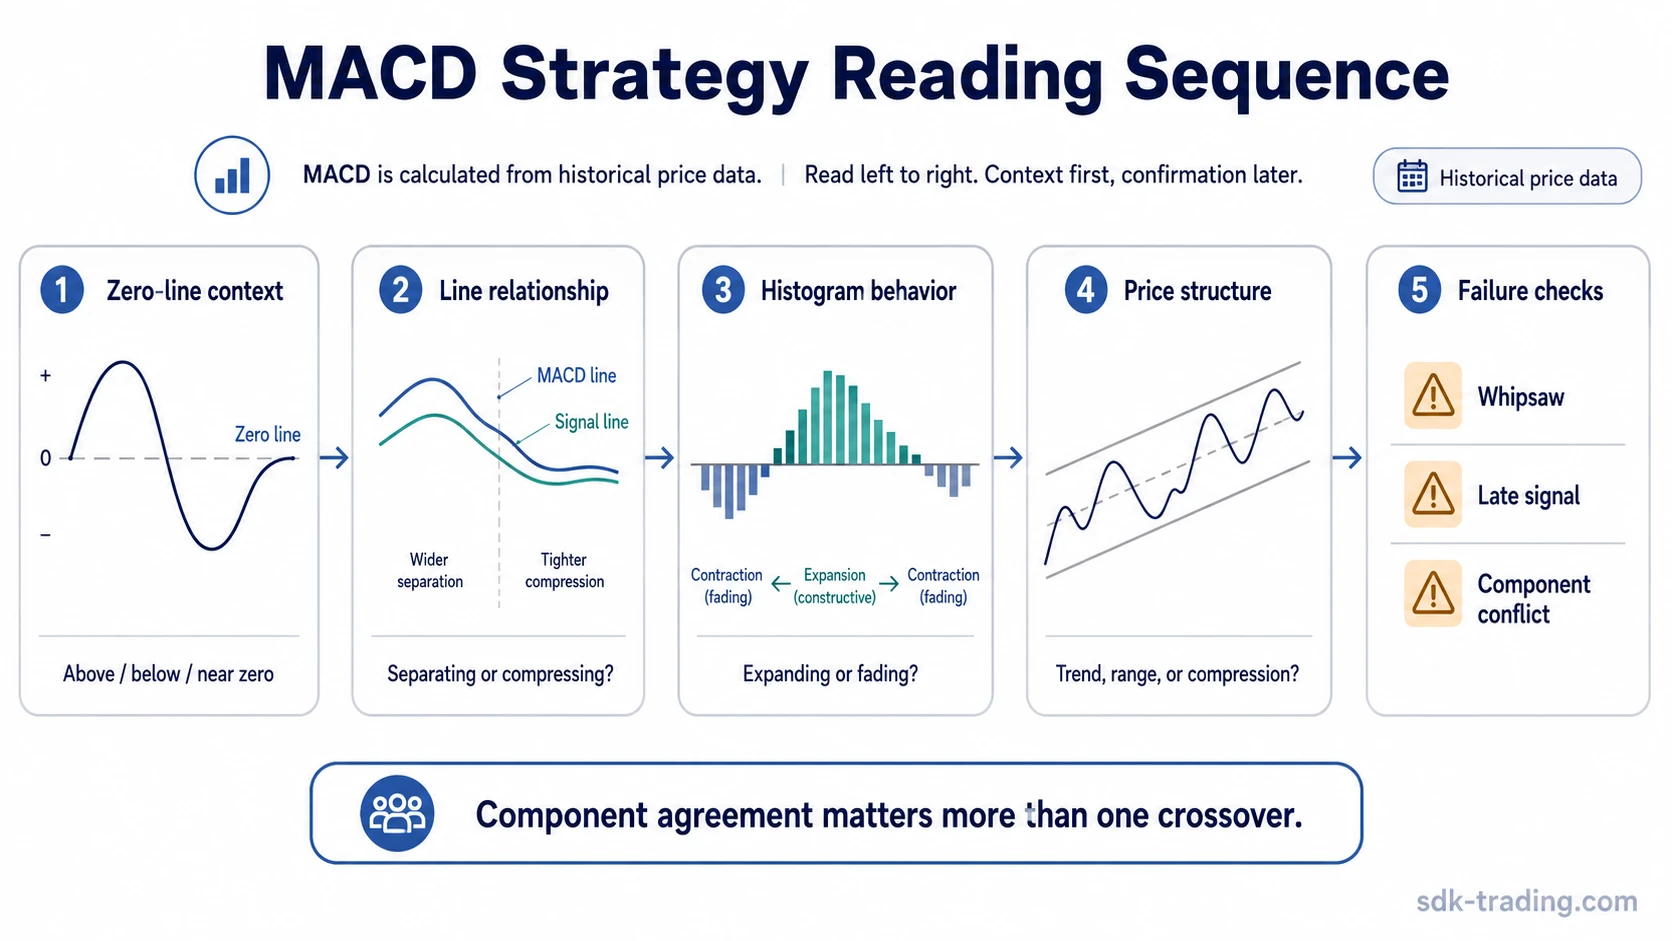
This order keeps the reading conditional. A line crossover receives more weight when it appears on the correct side of the zero line, the histogram expands in the same direction, and price structure is not contradicting the move.
MACD Components Used in the Strategy
MACD is built from exponential moving average relationships, so the EMA basis matters. The common 12/26/9 configuration is a widely used baseline, but the strategic question is not whether the default is perfect. The question is how the chosen setting changes responsiveness and noise.
| Component | What It Reads | What Weakens the Reading |
|---|---|---|
| MACD line | The difference between faster and slower EMA relationships. | Frequent direction changes without separation from the signal line. |
| Signal line | A smoothed reference line used to compare MACD line changes. | Small crosses that occur inside a choppy range. |
| Histogram | The distance between the MACD line and the signal line. | Flat, shrinking, or inconsistent bars after a crossover. |
| Zero line | The equilibrium boundary between positive and negative MACD values. | Clustering around zero, which can create repeated false starts. |
| Price structure | The market context that determines whether the indicator reading has support. | Sideways action, overlapping candles, or lack of directional acceptance. |
The MACD histogram is useful because it shows whether the line relationship is expanding or losing strength. A crossover with no histogram expansion is a different reading from a crossover followed by widening histogram bars.
Common MACD Strategy Patterns
The main MACD patterns are easy to name; their interpretation depends on surrounding evidence. A pattern should be treated as a reading condition, not as an instruction.
| Pattern | What Traders Often Read | Interpretation Boundary |
|---|---|---|
| Signal-line crossover | A change in the relationship between MACD line and signal line. | Useful only when separation, histogram behavior, and price structure do not contradict it. |
| Histogram expansion | Momentum between the MACD line and signal line is widening. | Stronger when it appears with clean line separation and supportive trend context. |
| Histogram contraction | Momentum is cooling or the prior move is losing pressure. | Can warn of weakening, but it does not prove reversal by itself. |
| Zero-line cross | MACD has moved from negative to positive territory, or the reverse. | More meaningful when it follows sustained separation, not when it is one of many small crosses. |
| Divergence | Price and MACD are no longer moving with the same internal pressure. | Useful as a warning condition, but weak if price structure has not changed. |
Divergence needs careful wording. It can show that momentum is no longer matching price behavior, but it does not predict the next move. A market can continue in the same direction after divergence if the broader structure remains intact.
When MACD Signals Become Weak
MACD becomes less reliable when it is asked to do more than it can. It is calculated from historical price data, so it naturally reacts after price relationships have already changed. That lag is not a defect by itself, but it becomes a problem when the reader treats a late or conflicted signal as fresh confirmation.
MACD limitation boundary:
- Historical-price basis: MACD is derived from past price data, so it does not predict future price movement.
- Lag: the indicator can respond after a move has already developed.
- Sideways markets: range conditions can create repeated crosses with limited follow-through.
- Settings sensitivity: faster settings may increase noise, while slower settings may delay the reading.
- Component conflict: a crossover is weaker when the histogram, zero line, or price structure disagrees.
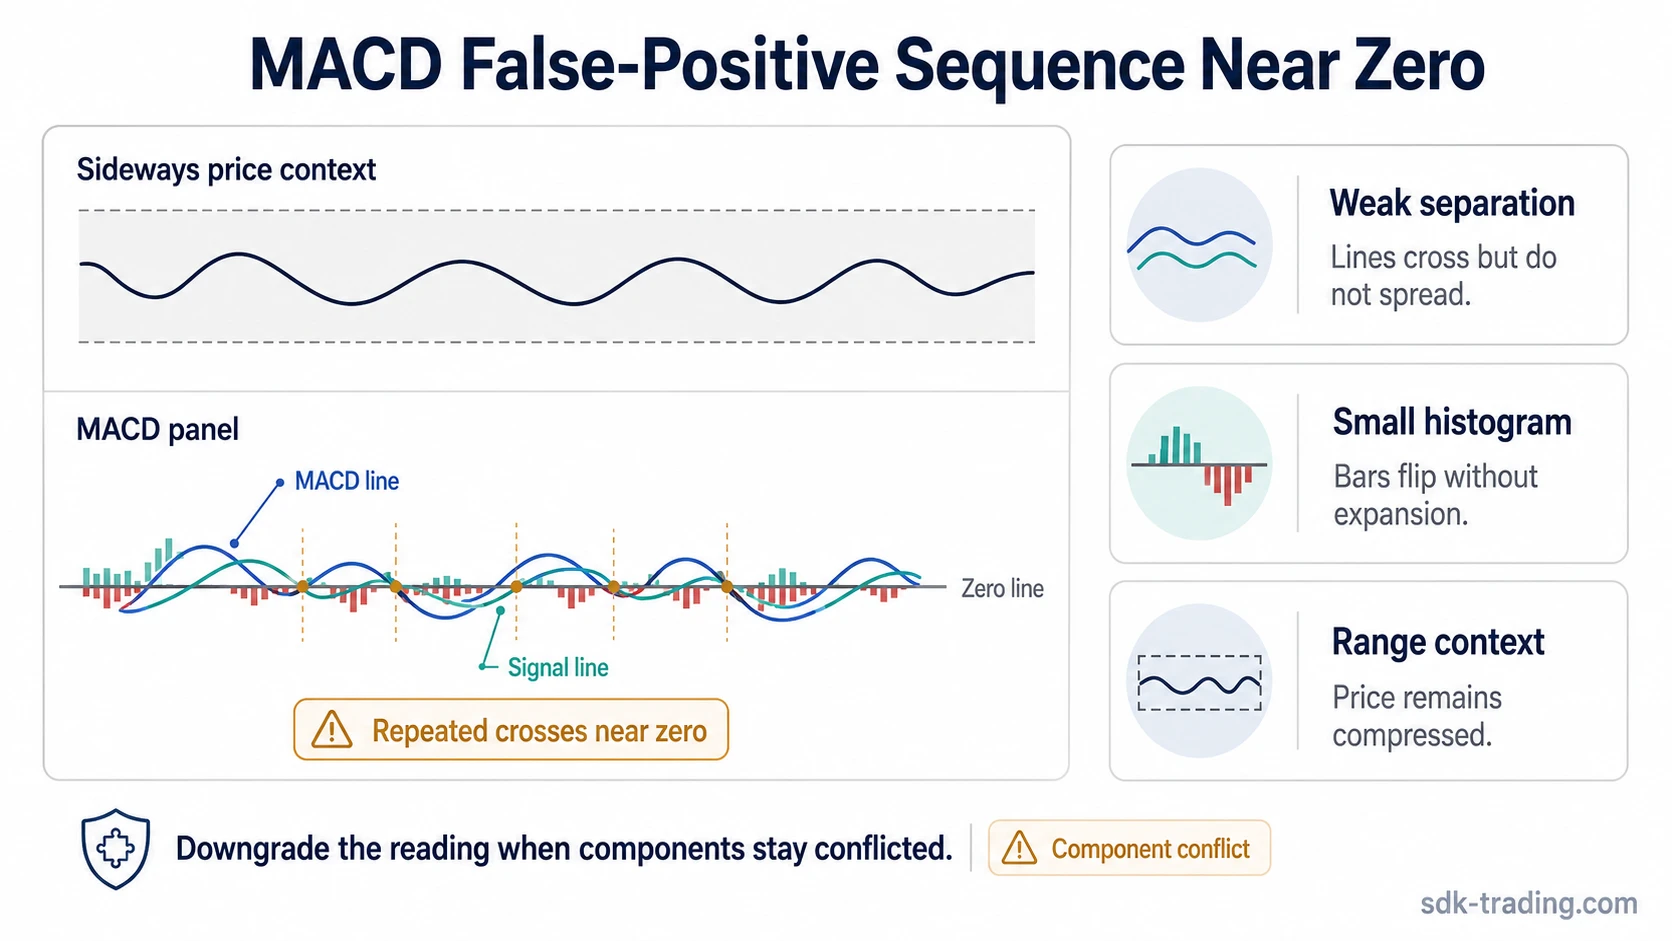
Repeated crossovers near the zero line are one of the clearest downgrade conditions. When MACD is clustered around equilibrium, the indicator may be describing compression rather than directional change. In that environment, a new crossover can be just another rotation inside noise.
Trend-strength context can help separate stronger directional environments from weak ones. For that reason, some traders compare MACD readings with ADX or another regime filter, but the added indicator should still be treated as context rather than proof.
A Safer MACD Reading Example
Consider a generic scenario where the MACD line crosses above the signal line. On its own, that looks like a momentum shift. The reading changes if MACD is still clustered near the zero line, the histogram barely expands, and price remains inside a tight range.
Illustrative scenario: A crossover appears while the zero-line context is neutral. The histogram prints only small bars and then begins to flatten. Price does not break from its range. In that situation, the crossover should be downgraded because component agreement is weak.
The crossover is not automatically “wrong.” The evidence is simply incomplete. A stronger interpretation would require broader agreement between line separation, histogram behavior, zero-line position, and price structure.
MACD Settings and Indicator Combinations
MACD settings change how sensitive the indicator is. Faster settings can react sooner but may create more noise. Slower settings can smooth the reading but may delay recognition. The setting choice should be treated as a sensitivity decision, not as a shortcut to a better outcome.
Indicator combinations can add context when they answer a different question. RSI may add overextension context. MFI may add a volume-related layer. RVI may add another momentum comparison. SMA can help identify broader trend direction. None of these automatically confirms a MACD reading.
Some readers also compare MACD with smoother trend tools such as HMA. That can help organize trend context, but it should not turn MACD analysis into a separate strategy around another indicator. MACD should remain the main object of interpretation, while other indicators only add context.
How to Use the MACD Strategy Without Turning It Into a Signal List
A more disciplined use of MACD is to treat each component as a question. Is the indicator above or below zero? Are the MACD line and signal line separating or compressing? Is the histogram confirming that separation? Does price structure support the same interpretation? Are repeated crosses or range conditions weakening the reading?
This approach keeps the strategy inside its proper role. MACD can organize momentum evidence, but it does not define risk, position size, trade location, or future outcome. Those decisions require a separate process and should not be implied by an indicator crossover.
Framework rule: the MACD reading improves when multiple components agree and weakens when the crossover, histogram, zero-line context, and price structure point in different directions.
MACD Strategy FAQ
What is a MACD strategy?
A MACD strategy is a framework for reading the MACD line, signal line, histogram, zero line, and price context together. It treats MACD as a sequence of evidence rather than one isolated signal.
Does every MACD crossover matter?
No. A crossover becomes weaker when it happens near the zero line, when the histogram does not expand, or when price remains inside a sideways range.
What MACD settings are best?
There is no universal best setting. Common defaults such as 12/26/9 are widely used, but settings mainly change sensitivity, noise, and lag.
Why does MACD fail in sideways markets?
Sideways markets can create repeated line crosses without sustained directional movement. In that environment, MACD may describe rotation around equilibrium rather than a durable shift.
Can MACD be used with RSI?
Yes, MACD can be compared with RSI as an additional context layer. RSI does not prove the MACD reading; it only adds another view of momentum or overextension.