A weighted moving average indicator is a trading indicator that assigns larger linear weights to newer prices inside a fixed lookback window, so recent price changes affect the line more than older prices.
WMA is still a moving average. It smooths price data and creates a line that follows the market with a delay. The difference is the weighting method: the newest price receives the largest weight, the next newest price receives a smaller weight, and the oldest price inside the lookback window receives the smallest weight.
Definition: The weighted moving average indicator, or WMA, calculates an average price by multiplying each price in the lookback period by a weight, then dividing the weighted total by the sum of all weights. In a standard linear WMA, newer prices carry more influence than older prices.
Key Points
- WMA gives more weight to recent prices, unlike SMA, which weights each price equally.
- The WMA formula uses a weighted sum divided by the total of all weights in the lookback period.
- WMA usually reacts faster than SMA, but it still lags because it is calculated from past prices.
- Fast reaction can become misleading when price spikes briefly, reverses, or moves sideways with repeated line changes.
What Is a Weighted Moving Average Indicator?
The weighted moving average indicator is a price-smoothing tool used in technical analysis. It reduces some of the noise in raw price movement while giving stronger influence to the most recent prices in the selected lookback period.
A 20-period WMA, for example, calculates from the last 20 prices. The newest price receives the highest weight, the oldest price receives the lowest weight, and the finished value becomes one point on the WMA line. As each new price appears, the window rolls forward and the calculation updates.
The line can help describe the current direction of smoothed price behavior, but it does not prove trend strength by itself. A rising WMA means the weighted average is rising. A falling WMA means the weighted average is falling. The quality of that reading depends on surrounding price behavior, volatility, and whether the market is trending or moving sideways.
How the WMA Formula Weights Recent Prices
The standard WMA formula multiplies each price by a linear weight. If the newest price is assigned the largest number and the oldest price is assigned the smallest number, the most recent price has the strongest effect on the final WMA value.
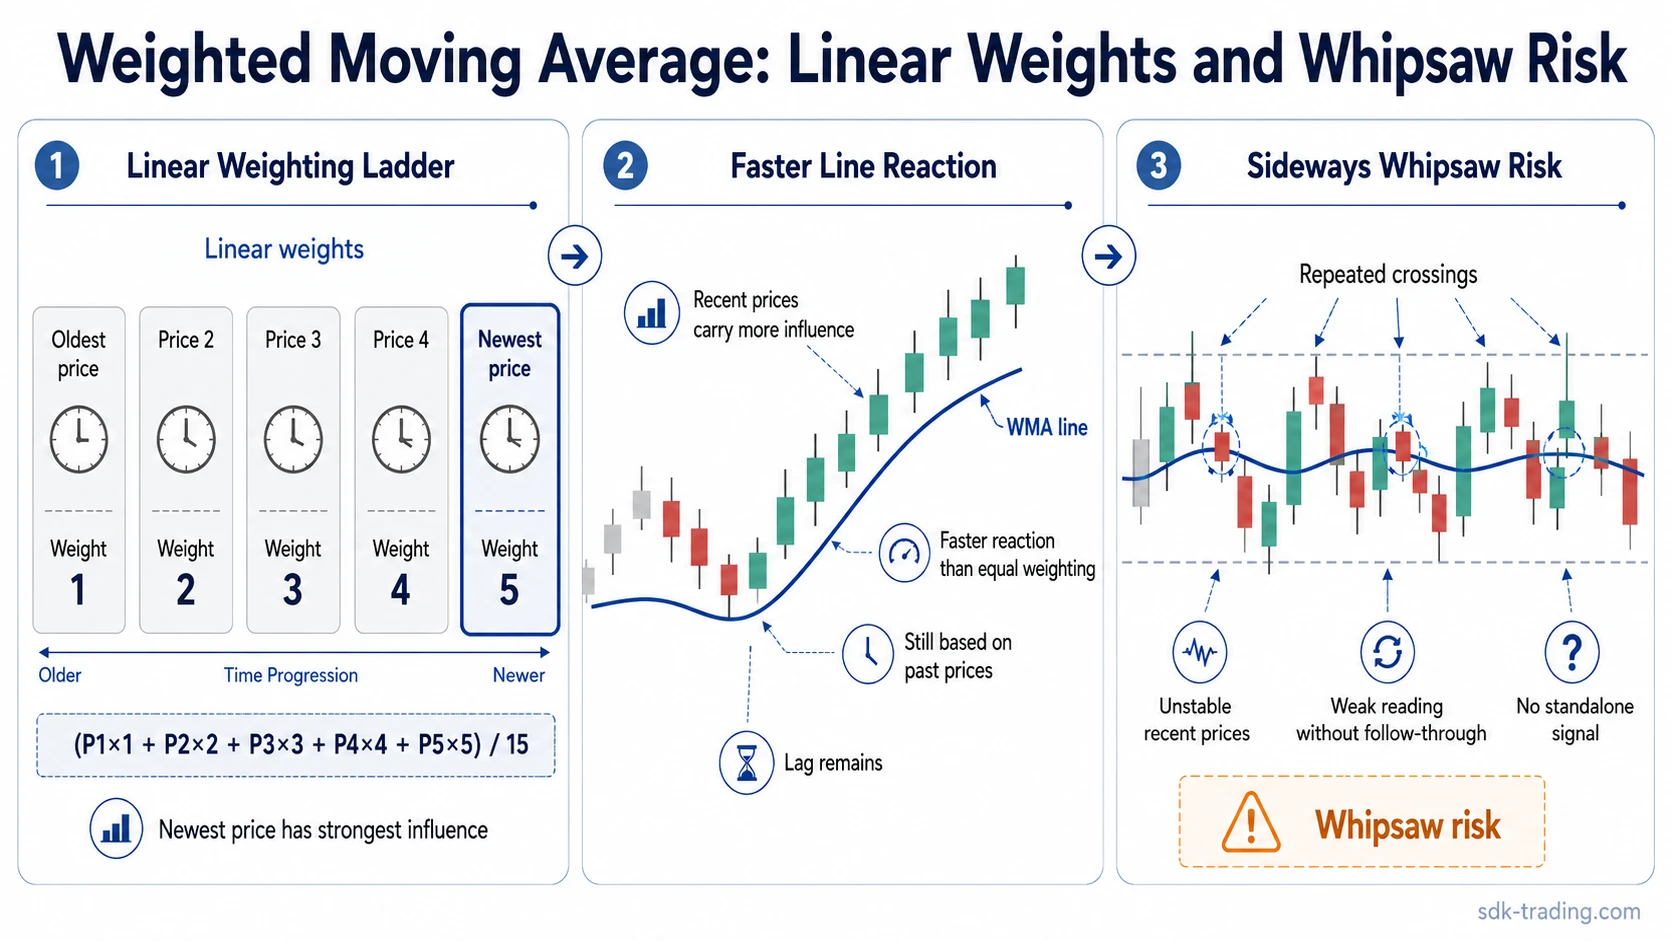
Simplified formula: WMA = weighted price total / sum of weights. For a 5-period WMA, that can be written as: (P1 x 1 + P2 x 2 + P3 x 3 + P4 x 4 + P5 x 5) / 15, where P5 is the newest price.
The denominator is 15 because 1 + 2 + 3 + 4 + 5 = 15. The newest price receives 5 parts out of 15, while the oldest price receives only 1 part out of 15. That is why a recent price jump can bend WMA faster than a simple moving average with the same length.
| Price position in a 5-period WMA | Linear weight | Share of total weight | Interpretation |
|---|---|---|---|
| Oldest price | 1 | 1 / 15 | Lowest influence on the current WMA value |
| Second oldest price | 2 | 2 / 15 | More influence than the oldest price, but still limited |
| Middle price | 3 | 3 / 15 | Moderate influence inside the lookback window |
| Second newest price | 4 | 4 / 15 | Strong influence on the current WMA value |
| Newest price | 5 | 5 / 15 | Strongest influence on the current WMA value |
This weighting ladder is the core WMA mechanism. The indicator reacts faster because the calculation gives newer prices more mathematical influence, not because it has predictive information.
Why WMA Can React Faster Than SMA
WMA responsiveness means the line can turn more quickly when recent prices change. A shorter WMA or a strongly moving recent price can make the line react sooner than a longer or equally weighted average.
That responsiveness has a tradeoff. When the market is moving cleanly, WMA may reflect the new price direction earlier than SMA. When price movement is unstable, the same weighting can turn a brief spike or sudden reversal into an exaggerated line change.
Example: Price can rise quickly after a sideways range and pull the WMA upward faster than SMA. If price then falls back into the same range and the WMA bends down again, the faster response is not stronger evidence. It is a recent-price reaction inside unstable movement.
WMA vs SMA and EMA
WMA, SMA, and EMA all smooth price, but they do not weight price the same way. The distinction is calculation method, not universal quality. A faster line is not automatically a better line.
| Moving average type | How prices are weighted | Main effect | Main limitation |
|---|---|---|---|
| Simple moving average | Every price in the lookback period receives equal weight. | Smoother and slower response to recent price changes. | Can lag more when price direction changes quickly. |
| Weighted moving average | Newer prices receive larger linear weights than older prices. | More responsive to recent price movement than SMA. | Can overreact when recent price movement is temporary or choppy. |
| Exponential moving average | Recent prices receive greater influence through exponential smoothing. | Responsive line that carries prior smoothing through the calculation. | Can still produce false readings in unstable or sideways markets. |
The difference between EMA and WMA is mainly the weighting structure. WMA uses a visible linear ladder inside the lookback window. EMA uses exponential smoothing, so recent prices matter more, but the calculation does not follow the same simple 1, 2, 3, 4, 5 style weighting ladder.
When WMA Readings Become Weak or Misleading
A WMA line can be useful when price is moving with enough continuity for the weighted average to describe direction. The reading becomes less useful when the newest prices are unstable, because those prices receive the strongest influence in the calculation.
| WMA reading condition | What appears on the line | Interpretation boundary |
|---|---|---|
| Clean WMA reading | The line slopes in one direction while price generally respects the same directional structure. | The weighted average is aligned with recent price behavior, but price structure still matters. |
| Weak WMA reading | The line turns, but price does not hold the area that caused the turn. | The line may be reacting to a temporary price move rather than a durable shift. |
| False or whipsaw-prone reading | The line changes direction repeatedly inside a range or after brief price spikes. | The WMA is responding quickly, but the market is not producing stable directional acceptance. |
Whipsaw risk increases when price crosses the WMA repeatedly and the line keeps bending back and forth. The formula may still be calculated correctly, but recent-price weighting can amplify short-lived movement when directional follow-through is absent.
How WMA Differs From Other Trend Tools
WMA is a smoothing line. It does not measure directional strength directly and it does not create a band-based trend state. That boundary matters when comparing it with other trend indicators.
The Directional Movement Index focuses on directional movement and trend-strength structure rather than a weighted average of recent prices.
Supertrend uses ATR-based bands and flip logic, so its construction is different from WMA weighting. Both can appear near trend analysis, but they answer different chart-reading questions.
Common WMA Mistakes
A common mistake is treating WMA speed as proof of better information. WMA reacts faster than SMA because newer prices receive more weight, not because the indicator removes uncertainty.
Common mistake: A sharp WMA turn after one recent price surge can look meaningful before the market has shown follow-through. The reading is more fragile if price quickly returns to the prior range or if the line changes direction several times in a short span.
Another mistake is comparing WMA with SMA or EMA as if one version is always superior. A smoother line may reduce some noise but react later. A faster line may react earlier but become more sensitive to short-lived movement. The better question is whether the weighting method matches the market condition being interpreted.
Practical WMA Interpretation
WMA interpretation starts with construction. The line is a weighted average, so recent prices matter most. After that, interpretation depends on whether the market is producing stable movement or repeated reversals.
A rising or falling WMA describes the direction of the weighted average, not a complete trading condition by itself. The line is more useful when price behavior, trend structure, and volatility support the same reading.
Limitation: WMA cannot remove lag because it still uses past prices. It can reduce some delay compared with an equal-weighted average, but faster response also increases sensitivity to recent noise.
FAQ
What does WMA mean in trading?
WMA means weighted moving average. In trading, it refers to a moving average that gives more weight to recent prices inside a fixed lookback period.
What is the WMA formula?
The WMA formula divides the weighted price total by the sum of the weights. In a 5-period WMA, the newest price can receive weight 5, the oldest price weight 1, and the denominator becomes 15.
Is WMA faster than SMA?
WMA usually reacts faster than SMA with the same lookback length because recent prices receive larger weights. Faster reaction can also increase sensitivity to temporary price movement.
Is WMA better than EMA?
WMA is not automatically better than EMA. WMA uses linear weighting, while EMA uses exponential smoothing. The useful choice depends on the kind of price behavior being analyzed.