The directional movement index is a trading indicator system that uses +DI, -DI, and ADX to describe directional pressure and trend-strength context. +DI tracks positive directional movement, -DI tracks negative directional movement, and ADX measures the strength of that movement without showing bullish or bearish direction by itself.
Definition: The directional movement index, often called DMI, is Welles Wilder’s directional movement system. It separates directional pressure from trend strength by using +DI, -DI, and ADX as related but different readings.
DMI is often misread when the +DI and -DI lines are treated as complete directional messages. The direction lines describe pressure, but ADX supplies the strength context. A crossover can show that pressure has shifted, but it does not prove that a persistent trend has already formed.
Key Points
- The directional movement index is made of +DI, -DI, and ADX.
- +DI and -DI describe directional pressure, while ADX describes trend-strength context.
- ADX does not show bullish or bearish direction by itself.
- A +DI and -DI crossover needs ADX context before the reading is meaningful.
- DMI becomes weaker when the DI lines keep crossing while ADX stays low or flat.
What Is the Directional Movement Index?
The directional movement index compares positive and negative directional movement over a selected lookback period. It is built around three main lines: +DI, -DI, and ADX.
The +DI line represents positive directional movement. The -DI line represents negative directional movement. The ADX line measures how strong the directional movement is, but it does not decide whether the direction is bullish or bearish.
The useful distinction is that DMI separates direction from strength. +DI and -DI answer which side has more directional pressure. ADX answers whether that pressure is becoming persistent enough to classify as a stronger trend condition.
Directional Movement Index Components
DMI is easier to read when each component has a clear boundary. The direction lines can describe pressure, but they do not complete the interpretation without ADX.
| Component | What it measures | What it does not prove | Stronger reading | Weak or incomplete reading |
|---|---|---|---|---|
| +DI | Positive directional movement | It does not prove a complete uptrend by itself. | +DI stays above -DI while ADX rises or remains strong. | +DI crosses above -DI briefly while ADX is low or flat. |
| -DI | Negative directional movement | It does not prove a complete downtrend by itself. | -DI stays above +DI while ADX supports trend strength. | -DI crosses above +DI briefly inside a range. |
| ADX | Strength of directional movement | It does not show bullish or bearish direction by itself. | ADX rises or holds above a trend-strength zone. | ADX stays low or flat while the DI lines keep crossing. |
Some platforms also show ADXR, a smoother ADX reference, but +DI, -DI, and ADX are enough for the basic DMI reading.
The main reading comes from the relationship between the lines. +DI above -DI can indicate stronger upward pressure. -DI above +DI can indicate stronger downward pressure. ADX decides whether that pressure is appearing in a stronger trend environment or inside a weaker, more rotational condition.
How the Directional Movement Index Is Calculated
DMI begins by comparing the current period’s high and low against the previous period’s high and low. The indicator then classifies directional movement into positive directional movement and negative directional movement.
| Step | Calculation idea | What it contributes to DMI |
|---|---|---|
| High and low comparison | Compare the current high and low with the previous high and low. | Identifies whether upward or downward movement is stronger. |
| +DM and -DM | Classify positive and negative directional movement. | Creates the raw directional pressure inputs. |
| True Range context | Normalize directional movement against price range. | Keeps directional movement tied to volatility and range size. |
| Smoothing | Smooth +DM, -DM, and True Range, commonly with Wilder-style smoothing. | Reduces raw period-to-period noise. |
| +DI and -DI | Convert smoothed directional movement into direction lines. | Shows positive and negative directional pressure. |
| DX and ADX | Measure and smooth the separation between +DI and -DI. | Creates the trend-strength context. |
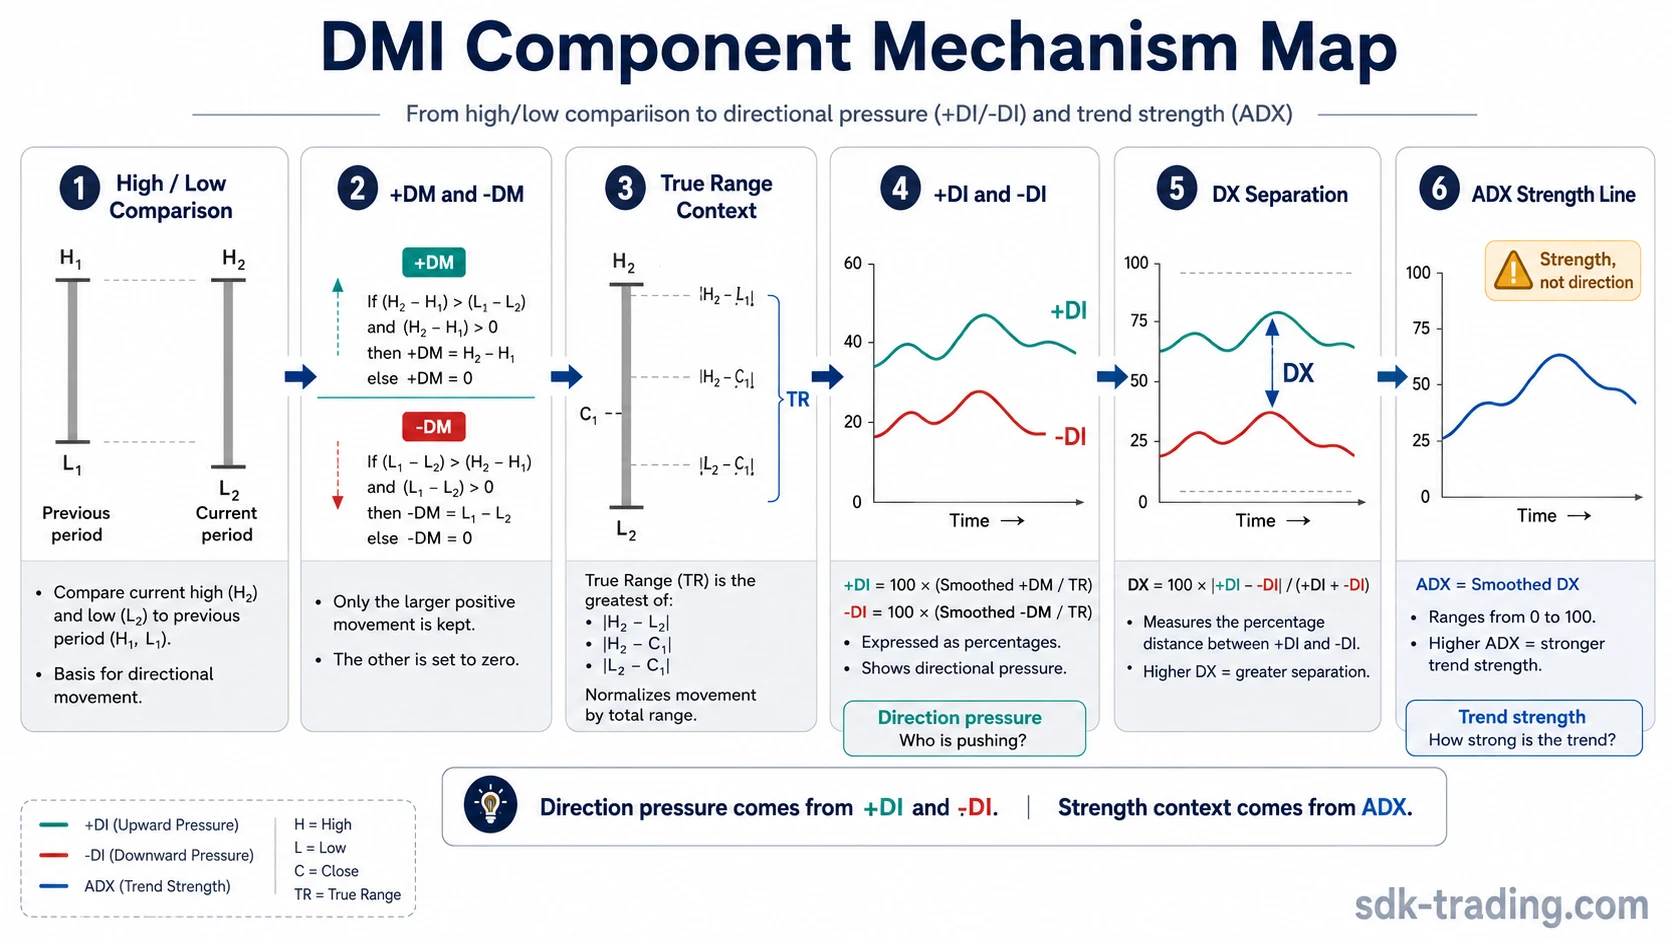
The calculation path shows why DMI is not just a moving average of price. A smoothing tool such as WMA weights price data directly, while DMI smooths directional movement relative to range.
How to Read +DI, -DI, and ADX Together
A DMI reading starts with the direction lines, then checks ADX for strength context. When +DI is above -DI, positive directional movement is stronger than negative directional movement. That can indicate upward pressure, but the reading is stronger when the separation between the lines expands and ADX rises or remains in a stronger trend zone.
When -DI is above +DI, negative directional movement is stronger than positive directional movement. That can indicate downward pressure, but the same strength filter applies. A brief -DI move above +DI carries less weight when ADX is low and the market is rotating sideways.
Line separation matters because a small crossover can happen during noise. Wider separation suggests one side is dominating more clearly. ADX adds the next layer by showing whether the directional movement is gaining strength or fading into a choppy environment.
| Reading type | DI behavior | ADX behavior | Interpretation |
|---|---|---|---|
| More complete reading | One DI line stays above the other with expanding separation. | ADX rises or holds in a stronger zone. | Directional pressure has stronger trend-strength context. |
| Weak reading | +DI and -DI cross but separation stays narrow. | ADX remains low or flat. | Directional pressure is changing, but trend strength is not established. |
| Incomplete reading | DI lines cross repeatedly. | ADX stays low while price remains range-bound. | The indicator is describing rotation, not a complete directional message. |
| Late reading risk | DI separation appears after a large move. | ADX is already elevated or flattening. | The indicator may be describing an existing move rather than a fresh shift. |
Directional Movement Index Thresholds
ADX thresholds are usually read as classification zones, not commands. The exact interpretation can vary by market, timeframe, volatility regime, and smoothing length.
| ADX zone | Common interpretation | DMI reading risk |
|---|---|---|
| Below 20 | Weak or non-trending context | DI crossovers can become noisy or short-lived. |
| 20 to 25 | Transition or ambiguous zone | Trend strength may be developing, but the reading is not clean yet. |
| Above 25 | Stronger trend-strength classification | Directional pressure has more context, but direction still comes from +DI and -DI. |
ADX does not decide direction. A rising ADX can occur during a bullish advance or a bearish decline. The direction comes from whether +DI or -DI has the stronger position, while ADX describes the strength of directional movement.
Thresholds should also be treated as flexible. A fast-moving market can push ADX higher quickly, while a slow or mean-reverting market may keep ADX below common threshold zones for longer. The threshold is a context marker, not a universal rule.
When DMI Gives an Incomplete Reading
DMI often becomes misleading when price rotates inside a range. In that condition, +DI and -DI can cross several times because each small move inside the range changes short-term directional pressure. If ADX remains low or flat, the repeated crosses do not create a complete trend reading.
Example: A market moves between an upper and lower range boundary. Price rallies toward the upper side of the range, +DI crosses above -DI, and the display appears to shift upward. Then price rejects the upper area, rotates lower, and -DI crosses back above +DI. If ADX never rises, the stronger interpretation is unresolved rotation rather than a clean directional condition.
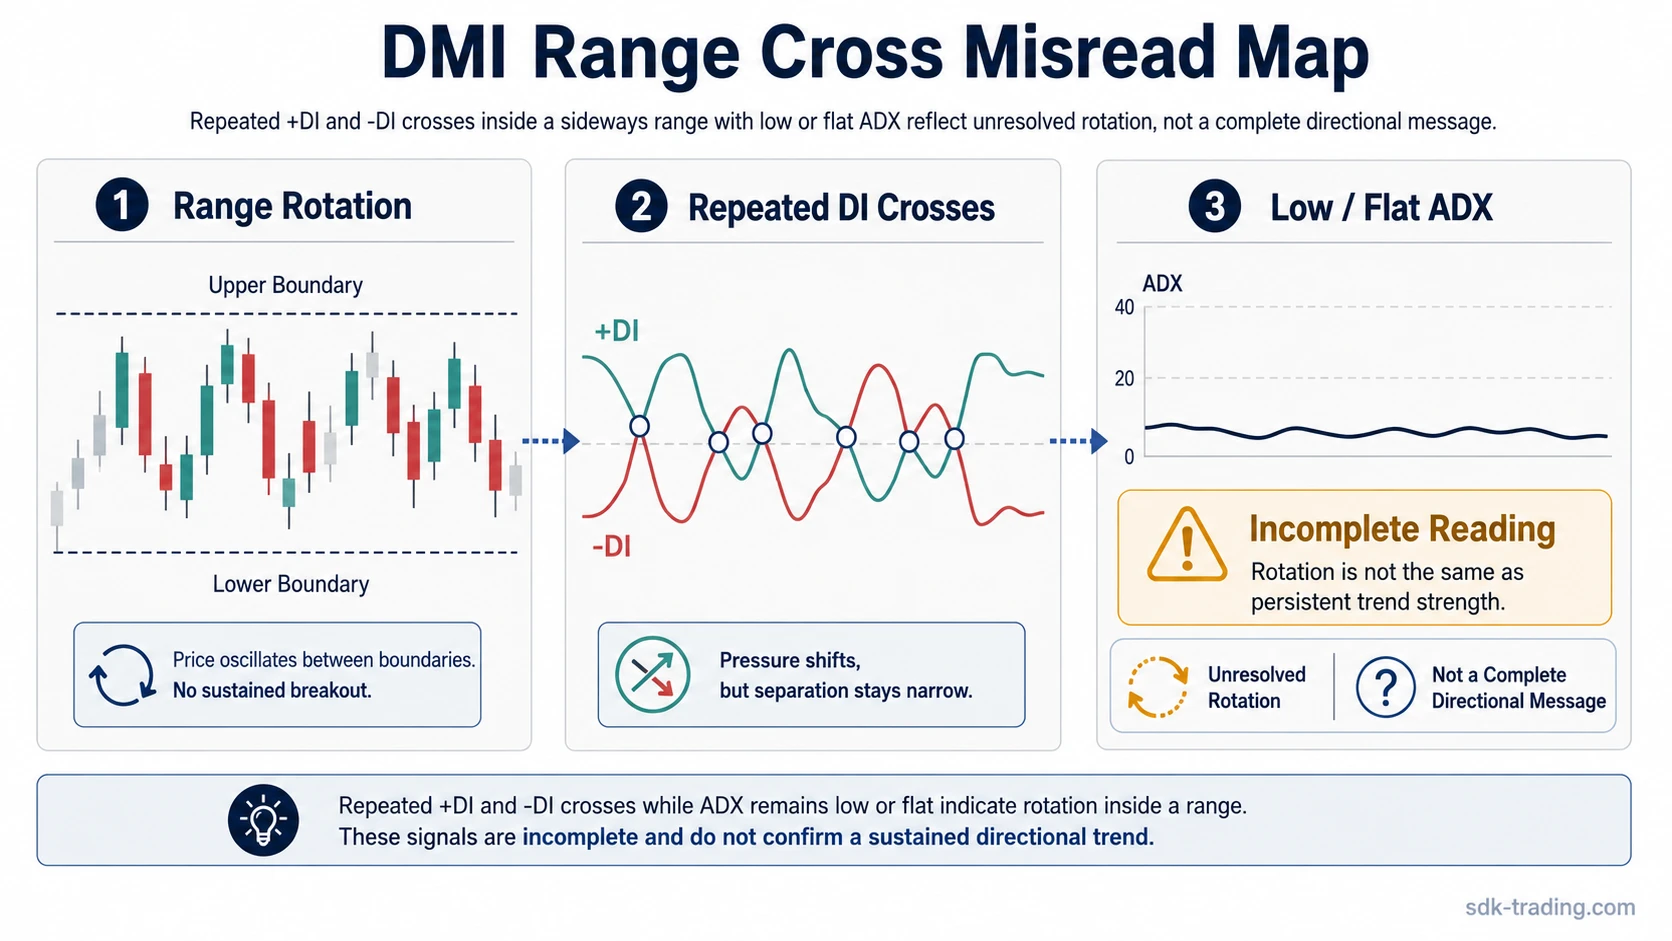
The reading becomes more interpretable when one side of the range starts to show persistence. That can mean wider DI separation, fewer immediate reversals between the DI lines, and ADX beginning to rise from a weak zone. Without that change, DMI may describe movement inside the range rather than a durable trend.
Directional Movement Index Settings
The common default setting for DMI is 14 periods. This setting is widely used because it comes from Wilder’s original directional movement framework, but it is not automatically the best setting for every market or timeframe.
Shorter DMI settings react faster. They can show directional pressure changes earlier, but they can also increase noise and produce more crossovers. Longer DMI settings smooth more of the movement. They can reduce short-term noise, but they may react later when directional conditions change.
The setting changes the sensitivity of the reading, not the basic logic. +DI and -DI still describe directional pressure. ADX still describes trend-strength context. A cleaner interpretation still depends on the relationship between those lines, not on a single “best” period length.
Directional Movement Index vs Related Indicators
DMI differs from indicators that measure momentum, smoothing, or price averaging in a different way. The MACD histogram visualizes the difference between MACD and its signal line, which makes it a momentum-style histogram. DMI is not a histogram and does not measure moving-average convergence or divergence.
DMI also differs from moving averages because it is not primarily smoothing closing prices into one trend line. DMI uses high-low comparisons, True Range context, and directional movement smoothing to separate upward pressure, downward pressure, and trend strength.
The closest distinction is between DMI and ADX. ADX is part of DMI, but ADX alone does not show direction. DMI includes the direction lines that ADX needs for directional interpretation.
Common Directional Movement Index Mistakes
The most common DMI mistake is treating a +DI and -DI crossover as a complete trend message. A crossover is only a pressure shift. The reading becomes more useful when ADX shows that directional movement is becoming persistent.
| Mistake | Why it fails | Better concept | Useful next check |
|---|---|---|---|
| Treating a +DI/-DI crossover as a complete signal | A crossover can happen during short-term noise. | Read the crossover as a pressure shift. | Check ADX strength context. |
| Ignoring ADX level or slope | Direction lines do not show trend strength by themselves. | Separate directional pressure from trend-strength classification. | Compare DI behavior with ADX behavior. |
| Assuming ADX shows direction | ADX measures strength, not bullish or bearish direction. | Use +DI and -DI for direction. | Use ADX only for strength context. |
| Treating 20 or 25 as universal thresholds | Thresholds vary by market, timeframe, and smoothing period. | Use thresholds as classification zones. | Check whether the reading fits current market behavior. |
| Reading DMI inside a range as if a trend already exists | Repeated DI crosses can reflect unresolved rotation. | Context before crossover interpretation. | Check whether ADX is rising or staying low and flat. |
The strongest DMI readings come from persistence rather than a single line event: one DI line holding above the other, wider line separation, and ADX supporting the strength context. When those pieces are missing, the reading remains conditional.
FAQ
Is DMI the same as ADX?
No. DMI includes +DI, -DI, and ADX. ADX is the strength component, while +DI and -DI provide the directional pressure context.
What does a +DI and -DI crossover mean?
A +DI and -DI crossover shows that directional pressure has shifted. The reading is incomplete unless ADX also supports a stronger trend-strength context.
Does DMI work in a ranging market?
DMI can become noisy in a ranging market because +DI and -DI may cross repeatedly while ADX stays low or flat. In that condition, the reading often reflects unresolved rotation rather than a clear trend.