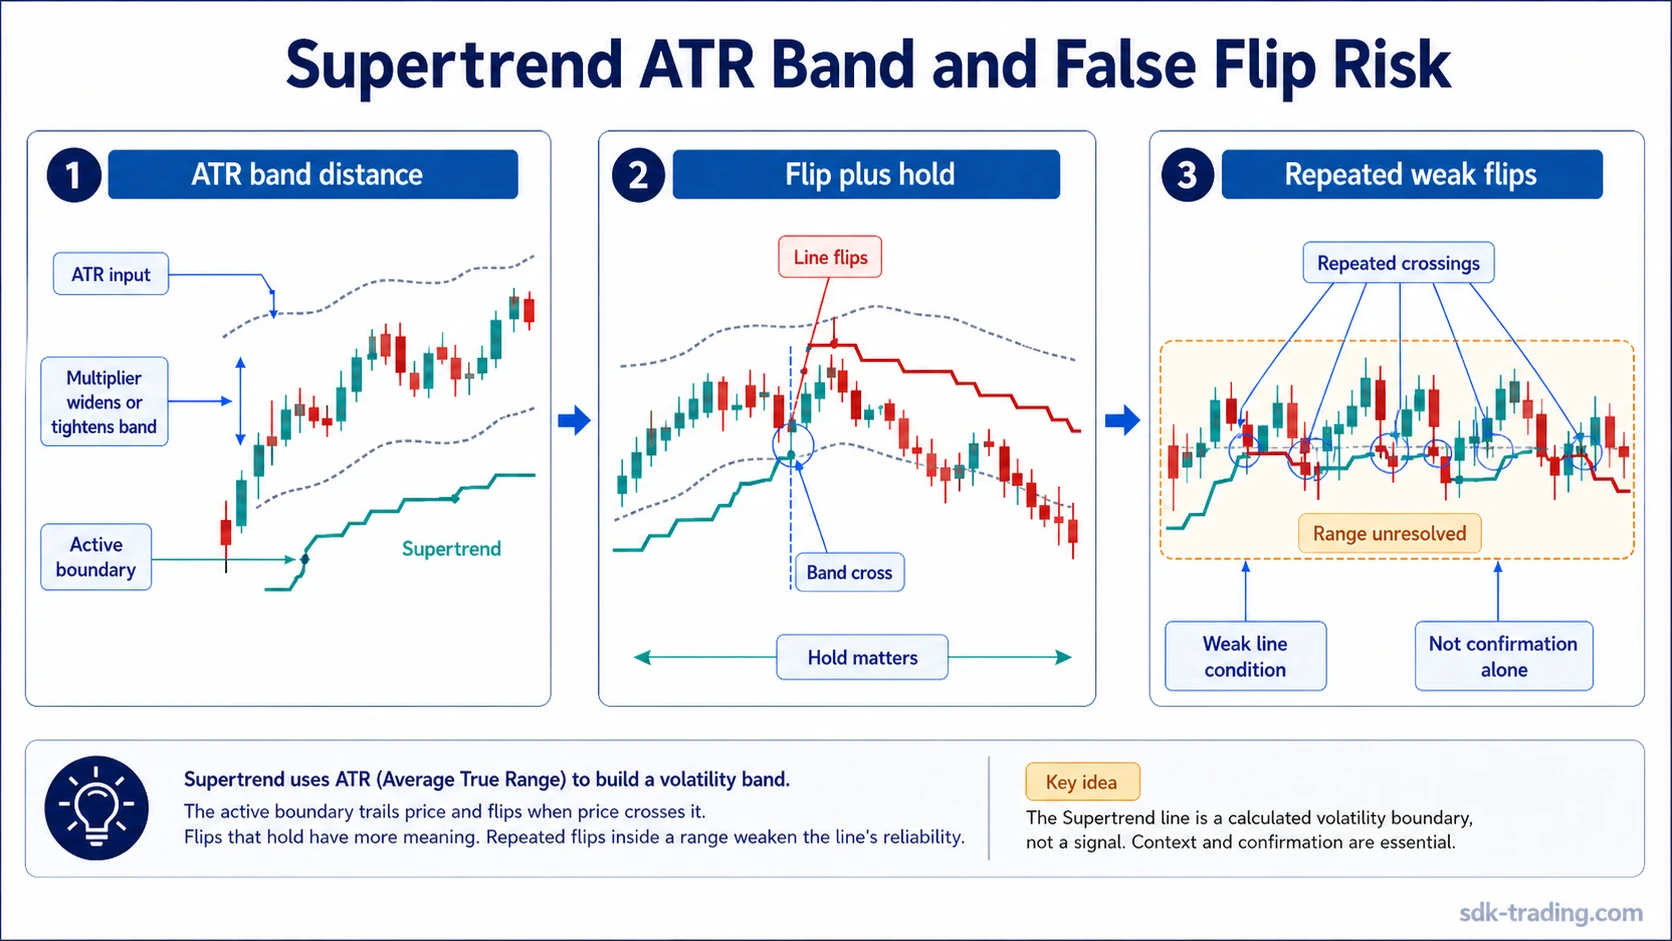
The Supertrend indicator is a volatility-adjusted trend overlay that plots an active line around price using Average True Range and a multiplier. When price crosses the active band, the line can switch sides, but that switch only marks a changed threshold condition. It does not confirm trend quality by itself.
Definition: The Supertrend indicator uses ATR-based bands to show whether price is holding above or below a volatility-adjusted line. Its main purpose is to make trend state easier to see, not to prove that a trend is strong, reliable, or ready to continue.
The useful reading is not the color or side of the line alone. A cleaner interpretation depends on whether price stays on the new side of the band, whether the market has directional structure, and whether the next candles avoid an immediate return into the same range.
Key Points
- Supertrend is built from ATR and a multiplier, so its distance from price changes with volatility.
- Shorter or tighter settings make the line more reactive, while longer or wider settings make it slower.
- A flip marks a threshold change, not confirmation by itself.
- Sideways markets can create repeated false flips because price keeps crossing the active band without sustained directional structure.
What Is the Supertrend Indicator?
The Supertrend indicator is a trend-following overlay that appears as a line above or below price. The line is calculated from volatility rather than simple price averaging, which makes it different from smoothing indicators that directly average closing prices.
When price is above the active Supertrend line, the indicator usually displays a positive trend condition. When price is below the active line, it usually displays a negative trend condition. The important distinction is that the line describes where price sits relative to a calculated boundary. It does not measure trend strength, volume quality, market participation, or whether a move has enough follow-through to remain valid.
Common misunderstanding: A Supertrend color change is often treated as if it settles the trend question. A safer reading treats the flip as the start of the question: did price only cross a volatility band, or did the market hold the new side with enough structure to make the reading cleaner?
How Supertrend Uses ATR and a Multiplier
Supertrend uses Average True Range to estimate recent volatility. ATR expands when price movement becomes wider and contracts when movement becomes narrower. The multiplier, sometimes called the factor, adjusts how far the Supertrend bands sit from the price calculation used by the indicator.
A higher multiplier usually places the active band farther from price. That reduces frequent flips but makes the line slower to react. A lower multiplier usually places the band closer to price. That can catch line changes earlier, but it can also react to ordinary noise.
| Element | What it controls | Interpretation risk |
|---|---|---|
| ATR length | How much recent volatility history is included | A very short length may overreact to temporary volatility changes |
| Multiplier or factor | How far the band is placed from the price calculation | A tight factor may flip too often, while a wide factor may lag |
| Active band | The boundary currently used to define the displayed trend condition | The line can look decisive even when price is only moving sideways around it |
A compact way to understand the calculation is that Supertrend builds upper and lower volatility bands from a price baseline plus or minus ATR multiplied by the chosen factor. Implementations can vary in details, so the formula is best treated as mechanism guidance rather than a universal platform guarantee.
How the Supertrend Line Flips
The Supertrend line flips when price crosses the active boundary used by the indicator. In a rising condition, the active line is usually below price. If price breaks below the relevant band, the line can move above price and mark a negative condition. In a falling condition, the active line is usually above price. If price breaks above the relevant band, the line can move below price and mark a positive condition.
The flip is easy to see, which is why the indicator is popular. The harder part is judging whether the flip occurred in a market with enough directional structure. A clean band-side change after a stable directional move carries a different meaning from a flip that happens inside a narrow, overlapping range.
Simple Supertrend example: Price moves sideways between two nearby areas and repeatedly crosses the active Supertrend line. Each cross can force the indicator to change condition, but price keeps returning inside the range after each flip. The reading remains weak because the market is crossing the line without holding either side for long.
Supertrend Settings: ATR Length and Multiplier
Supertrend settings change sensitivity. They do not create a universal best version of the indicator. A setting that looks cleaner in one market condition can become late, noisy, or misleading in another.
| Setting choice | Typical effect | Main trade-off in interpretation |
|---|---|---|
| Shorter ATR length | Responds faster to recent volatility changes | Can make temporary noise look more important than it is |
| Longer ATR length | Smooths volatility input over more candles | Can react late after volatility has already changed |
| Lower multiplier | Places the band closer to price | Can create repeated flips in choppy conditions |
| Higher multiplier | Places the band farther from price | Can reduce noise but delay the visible line change |
The setting question is therefore contextual. A tight setting can be useful for observing early line changes, but it can also convert ordinary range movement into a sequence of weak flips. A wider setting can reduce that noise, but it may leave the displayed line far behind price after a sharp move.
What a Supertrend Flip Actually Means
A Supertrend flip means price has crossed the active ATR-based band used by the indicator. It does not prove that the new direction has strong participation, clean structure, or durable continuation.
A cleaner reading usually develops when price remains on the new side of the active line and the next candles do not immediately reclaim the previous side. A weaker reading appears when price flips the line and then quickly returns through it, especially if the broader chart remains range-bound.
Interpretation boundary: Supertrend can define a calculated line condition. It cannot show volume quality, trend strength, order-flow pressure, or whether the next move will continue. Those questions require separate evidence.
Clean, Weak, and Invalid Supertrend Readings
The most useful Supertrend reading separates the visible line change from the quality of the market behavior around it. The same flip can be clean, weak, or invalid depending on what price does after crossing the band.
| Reading type | What price does | Why the interpretation changes |
|---|---|---|
| Clean reading | Price crosses the active band and remains on the new side | The line change aligns with follow-through instead of an immediate reversal back through the band |
| Weak reading | Price flips the line but keeps overlapping the same range | The indicator reacts to movement, but the chart does not show clear directional acceptance |
| Invalid reading | Price crosses the band and quickly reclaims the previous side | The flip failed to hold, so the line change did not become a stable condition |
This distinction helps prevent a common mistake: treating the line as if it contains all the context. The line can be useful, but its quality depends on the surrounding structure, not only the indicator condition.
Supertrend vs SMA and WMA
Supertrend is not a moving average in the usual smoothing sense. A SMA smooths price by giving each value in the selected period equal weight. Supertrend instead builds a volatility-adjusted band from ATR and a multiplier.
A WMA gives more weight to recent prices, which makes it more responsive than an equal-weight average. Supertrend changes responsiveness through volatility settings rather than by directly weighting recent closes.
| Indicator | Main input logic | What it helps observe |
|---|---|---|
| Supertrend | ATR-based band with multiplier | Whether price is holding above or below a volatility-adjusted line |
| SMA | Equal-weight price average | Smoothed price direction over a selected period |
| WMA | Weighted price average | Smoothed price direction with more emphasis on recent data |
Parabolic SAR also plots a trend-following overlay, while DMI/ADX and MACD use different logic to describe directional movement or momentum. The practical difference is that each tool answers a narrower question about trend state, direction, or momentum rather than replacing chart context.
Common Mistakes With Supertrend
Supertrend becomes weaker when the line is treated as a complete decision system. The indicator can identify a calculated band condition, but the chart still needs context around structure, volatility, and follow-through.
| Mistake | Why it creates a bad read | Safer interpretation |
|---|---|---|
| Treating every flip as confirmed direction | Price can cross a calculated line without sustained acceptance | Check whether the new side of the line holds after the flip |
| Searching for one best setting | Market conditions change volatility and noise levels | Treat settings as sensitivity controls, not performance controls |
| Ignoring sideways ranges | Range-bound price can flip the line repeatedly without trend quality | Separate line movement from directional structure |
| Reading Supertrend as a strength meter | The indicator is based on line position, not strength measurement | Use separate evidence for strength, participation, and momentum |
Supertrend Limitations
Supertrend can lag after a strong move because its line depends on volatility and prior price behavior. A wider setting may reduce noise, but it can also keep the active line far from current price. A tighter setting may react sooner, but it can become unstable inside a sideways market.
The indicator also does not explain why price is moving. It does not show whether volume supports the move, whether the broader market structure is healthy, or whether the move is only a short-lived reaction. Those limitations matter most when a chart alternates quickly between small advances and pullbacks.
Sideways-market limitation: Repeated flips inside a range are usually lower-quality information than a flip followed by price holding outside the range. The line can change condition while the market remains unresolved.
FAQ
What is the Supertrend indicator?
The Supertrend indicator is an ATR-based trend overlay that plots a volatility-adjusted line above or below price. It helps show the current line condition, but it does not confirm trend quality by itself.
What does the Supertrend multiplier do?
The multiplier controls how far the Supertrend bands sit from the price calculation. A lower multiplier usually makes the line more reactive, while a higher multiplier usually makes it slower and wider.
What is Supertrend offset?
In some platforms, offset can refer to a display or plotting adjustment rather than the ATR length or multiplier. Because platform terminology can vary, offset should not be treated as the same setting as the main Supertrend sensitivity controls.
Does the Supertrend indicator repaint?
Supertrend behavior can differ by platform or script. A live candle may move around the active line before it is confirmed, so visible line behavior can change during the candle. Platform-specific repainting claims should be checked against the exact implementation.
How reliable is Supertrend?
Supertrend is usually cleaner in directional markets and weaker in sideways or choppy markets. Reliability depends on settings, volatility, market structure, and whether price holds the new side of the active line after a flip.
Is Supertrend a moving average?
Supertrend is not a standard moving average. Moving averages smooth price directly, while Supertrend uses ATR and a multiplier to create a volatility-adjusted line.