Leading vs lagging indicators in trading are separated by timing behavior. Leading indicators react earlier because they are more sensitive to recent price or volume changes, while lagging indicators react later because they smooth or confirm movement after more evidence has formed.
The label describes timing behavior, not whether one indicator type is more reliable than the other.
Definition: A leading indicator is designed to respond before a move is fully established. A lagging indicator is designed to respond after movement has already developed. The label describes timing and responsiveness, not automatic quality, accuracy, or reliability.
The main difference is the question each tool answers. A leading response asks whether conditions are starting to shift. A lagging response asks whether enough movement has already appeared to support a more established interpretation.
Key Points
- Leading indicators react faster, but faster responses can create more noise.
- Lagging indicators react later, but delayed responses can filter some early false moves.
- The same chart can produce an early oscillator improvement and a delayed trend reading at the same time.
- Indicator role matters more than the label: timing, smoothing depth, parameters, and market condition change interpretation.
Difference Between Leading and Lagging Indicators in Trading
Leading indicators emphasize sensitivity. They respond quickly when recent price, momentum, or volume behavior changes. That early response can help identify a possible shift, but it can also react to temporary pauses that do not become meaningful changes.
Lagging indicators emphasize smoothing and delay. They reduce some short-term noise by using more historical data or slower calculations. That smoothing can make a response steadier, but it also means the indicator may react after much of the movement is already visible on the chart.
The practical distinction is timing role. A leading tool can be early and wrong. A lagging tool can be stable and late. A useful comparison starts with what the tool is designed to measure, then checks whether that role fits the market condition being interpreted.
Leading vs Lagging Indicators Comparison Table
| Comparison criterion | Leading indicators | Lagging indicators |
|---|---|---|
| Timing behavior | React earlier to recent changes in price, momentum, or volume. | React later after more movement has already developed. |
| Formula behavior | Often more sensitive to shorter lookback windows or recent turning behavior. | Often smoother because more data is averaged, filtered, or confirmed. |
| Typical role | Spot possible early rotation, exhaustion, divergence, or momentum change. | Track trend direction, trend strength, moving-average behavior, or established movement. |
| False-reading risk | Can react to noise before the market accepts the change. | Can confirm after the most useful early information has already appeared. |
| Market-condition sensitivity | Can struggle during choppy movement because small rotations appear often. | Can struggle during fast reversals because smoothing delays the response. |
| Common mistake | Treating an early reaction as if it predicts the next move. | Treating a delayed reading as if it is automatically safer. |
How Leading Indicators Work
Leading indicators work by emphasizing changes that appear before a full trend or structure shift is confirmed. Many oscillator-style tools are used this way because they can respond when momentum changes faster than price structure changes.
An RSI-type or stochastic-type reading may improve while price is still below a prior resistance area. That improvement does not prove that price will continue higher. It only shows that the indicator’s recent input has changed enough to produce an earlier response.
The weakness of a leading response is overreaction. A short pause in a decline, a brief bounce, or a temporary momentum change can look important before the market has shown acceptance. The earlier the tool reacts, the more carefully its noise risk has to be judged.
How Lagging Indicators Work
Lagging indicators work by waiting for more developed price behavior before the reading changes meaningfully. Smoothing is the reason they can appear steadier, but the same smoothing creates delay.
A moving average such as the EMA is often treated as a lagging-type tool because it follows price after averaging recent values. A shorter setting reacts faster, while a longer setting changes more slowly and filters more short-term movement.
Trend-strength tools can also behave with a lagging profile. ADX is commonly used to evaluate trend strength after directional movement has developed, rather than to identify the earliest possible turn.
The limitation is timing cost. A lagging response may become clearer only after the chart has already moved away from the earliest point of change. That does not make it useless; it means its role is different from an early rotation tool.
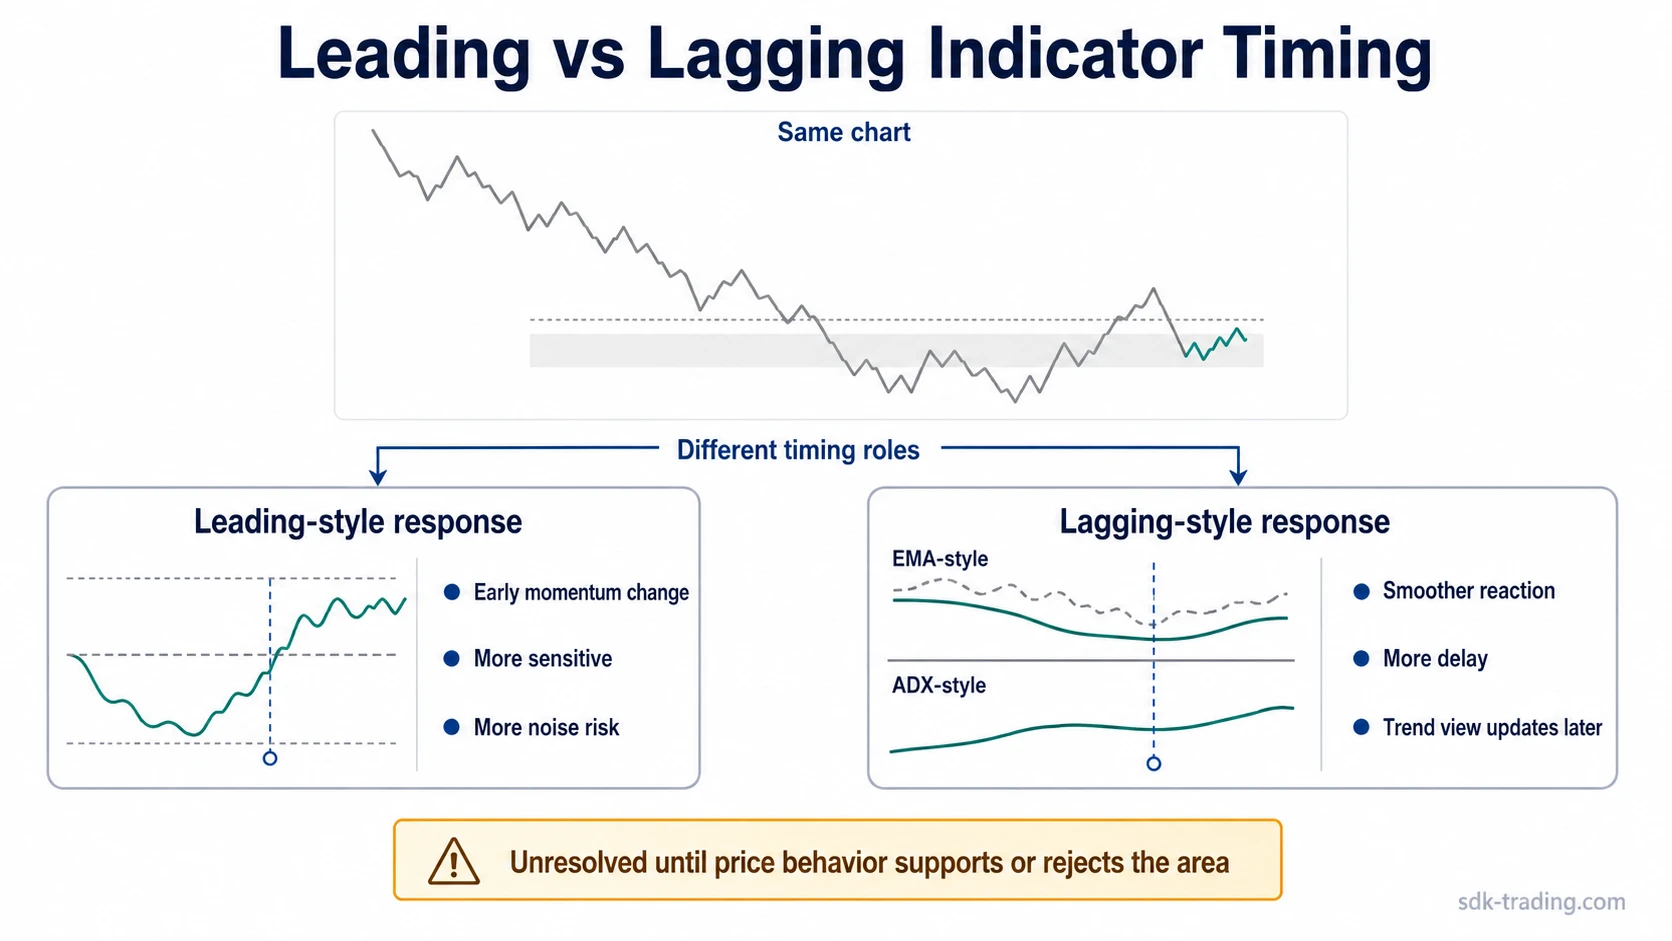
Same Chart, Different Indicator Reading
Example scenario: Price has been declining and then begins to pause near a prior reaction area. The next few candles stop making clean downside progress, and an RSI-type oscillator starts to rise from a depressed reading while price is still below the last lower high.
The reading remains unresolved if price cannot reclaim the prior reaction area or if the next recovery attempt stalls below the last lower high.
The leading-style response has changed first. It may suggest that downside momentum is easing, but the chart has not yet shown whether buyers can hold the recovery or reclaim the prior area.
At the same time, an EMA-based trend view may still slope lower because the average is carrying data from the prior decline. An ADX-style trend-strength reading may also remain slow to change because the earlier directional move still affects the calculation.
Both readings can be true. The oscillator is answering an early timing question: has recent momentum started to change? The smoothing or trend-strength reading is answering a later question: has enough evidence formed to change the broader trend interpretation?
Why One Type Is Not Automatically Better
Leading indicators are not better simply because they are earlier. Early information can be valuable, but it can also appear during weak pauses, short squeezes, failed bounces, and sideways noise. The interpretation becomes more defensible when price behavior begins to support the same shift instead of immediately rejecting it.
Lagging indicators are not better simply because they wait. Delay can reduce some premature readings, but it can also make the information less useful when the market changes quickly. A smoother tool may look calm while price is already rotating into a different condition.
Quality depends on fit. A fast oscillator may fit a short-term momentum question. A smoothed trend tool may fit a broader trend-state question. The wrong use is comparing them as if both tools are trying to answer the same timing problem.
Timing Spectrum and Hybrid Behavior
Leading and lagging are useful labels, but they are not always absolute categories. Settings, formulas, and market condition can move an indicator along a timing spectrum.
A shorter lookback period usually makes a tool more responsive. A longer lookback period usually makes it smoother and slower. The same indicator family can feel early under one setting and delayed under another.
Some tools also combine elements. A momentum tool may react quickly to recent changes but still use smoothing in its formula. A trend tool may lag by design but still turn faster when settings are shortened. The safer distinction is to ask how the calculation responds, not to rely only on the label.
Can Traders Combine Leading and Lagging Indicators?
Leading and lagging indicators can be combined when they serve different roles. The useful combination is not “more indicators.” It is role separation: one tool may test early momentum change, while another checks whether broader trend behavior has started to adjust.
The key distinction is timing roles, not building a full indicator stack. Combining tools becomes weaker when the indicators measure nearly the same thing. Two fast oscillators may create the feeling of agreement without adding much new information. Two heavily smoothed trend tools may confirm the same delay in slightly different ways.
A cleaner combination separates the question being asked. One reading can describe early sensitivity, another can describe smoothing or trend condition, and the chart itself can show whether price is accepting or rejecting the area being tested.
Common Mistakes With Leading and Lagging Indicators
| Mistake | Why it creates a problem | Cleaner interpretation |
|---|---|---|
| Treating early as accurate | A fast reaction can appear before price has accepted the change. | Read early movement as a possible shift, not as proof. |
| Treating delayed as safe | A smoother reading can appear after the market has already moved. | Use delay as a feature of the tool, not as a guarantee of reliability. |
| Stacking the same role | Multiple similar tools can repeat the same calculation logic. | Separate timing, trend, volatility, and structure roles before adding tools. |
| Ignoring parameter sensitivity | Shorter and longer settings can change how early or late the reading feels. | Judge the setting and market condition together. |
| Comparing labels instead of questions | Leading and lagging tools may be designed for different interpretive jobs. | Ask what timing problem the indicator is meant to solve. |
FAQ
What is the main difference between leading and lagging indicators in trading?
Leading indicators react earlier to recent price, momentum, or volume changes. Lagging indicators react later because they use more smoothing or wait for more developed movement.
Are leading indicators better than lagging indicators?
No. Leading indicators can be faster but noisier. Lagging indicators can be steadier but later. Usefulness depends on the timing question, market condition, and how the tool is interpreted.
Can one indicator behave as both leading and lagging?
Some indicators can behave differently under different settings or formulas. Shorter settings may react faster, while longer or more smoothed settings may behave with more lag.
Why can two indicators disagree on the same chart?
Two indicators can disagree because they measure different timing roles. A fast oscillator may react to early momentum change while a smoothed trend tool still reflects the prior movement.