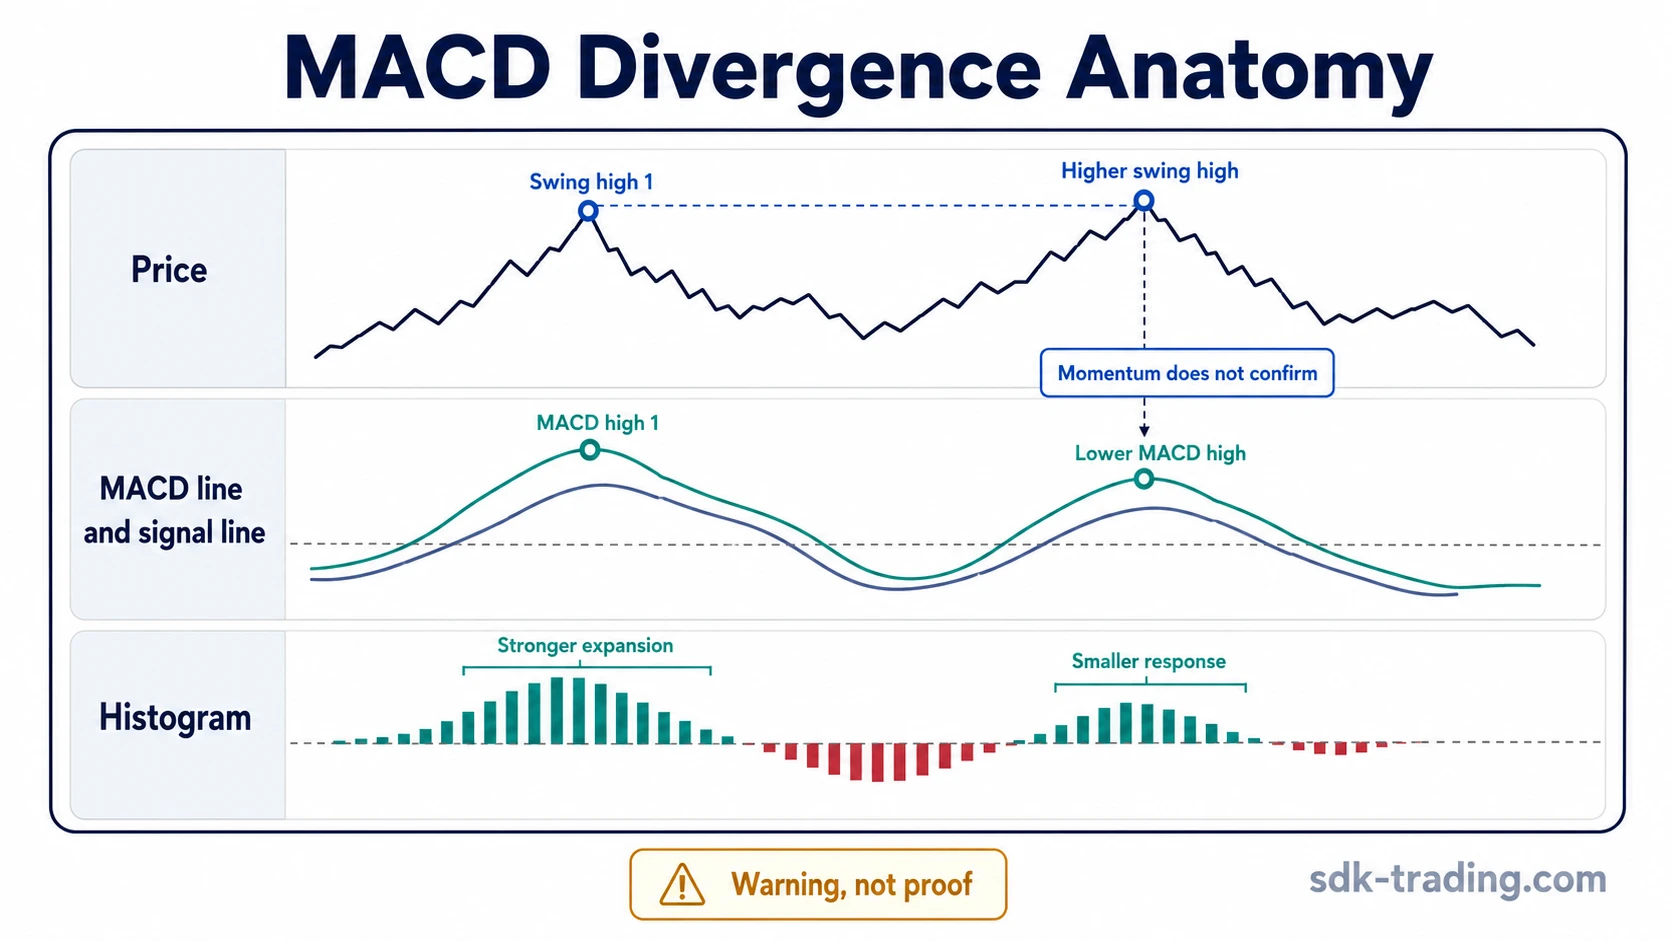
MACD divergence appears when price makes a new swing high or swing low, but MACD momentum does not confirm the same move. The mismatch can appear in the MACD line, the signal-line relationship, or the histogram, and it warns that momentum may be changing rather than proving that price must reverse.
Definition: MACD divergence is a trading momentum mismatch between price swings and the Moving Average Convergence Divergence indicator. Price extends to a new swing extreme, while the MACD reading shows weaker confirmation, flatter momentum, or a smaller histogram response.
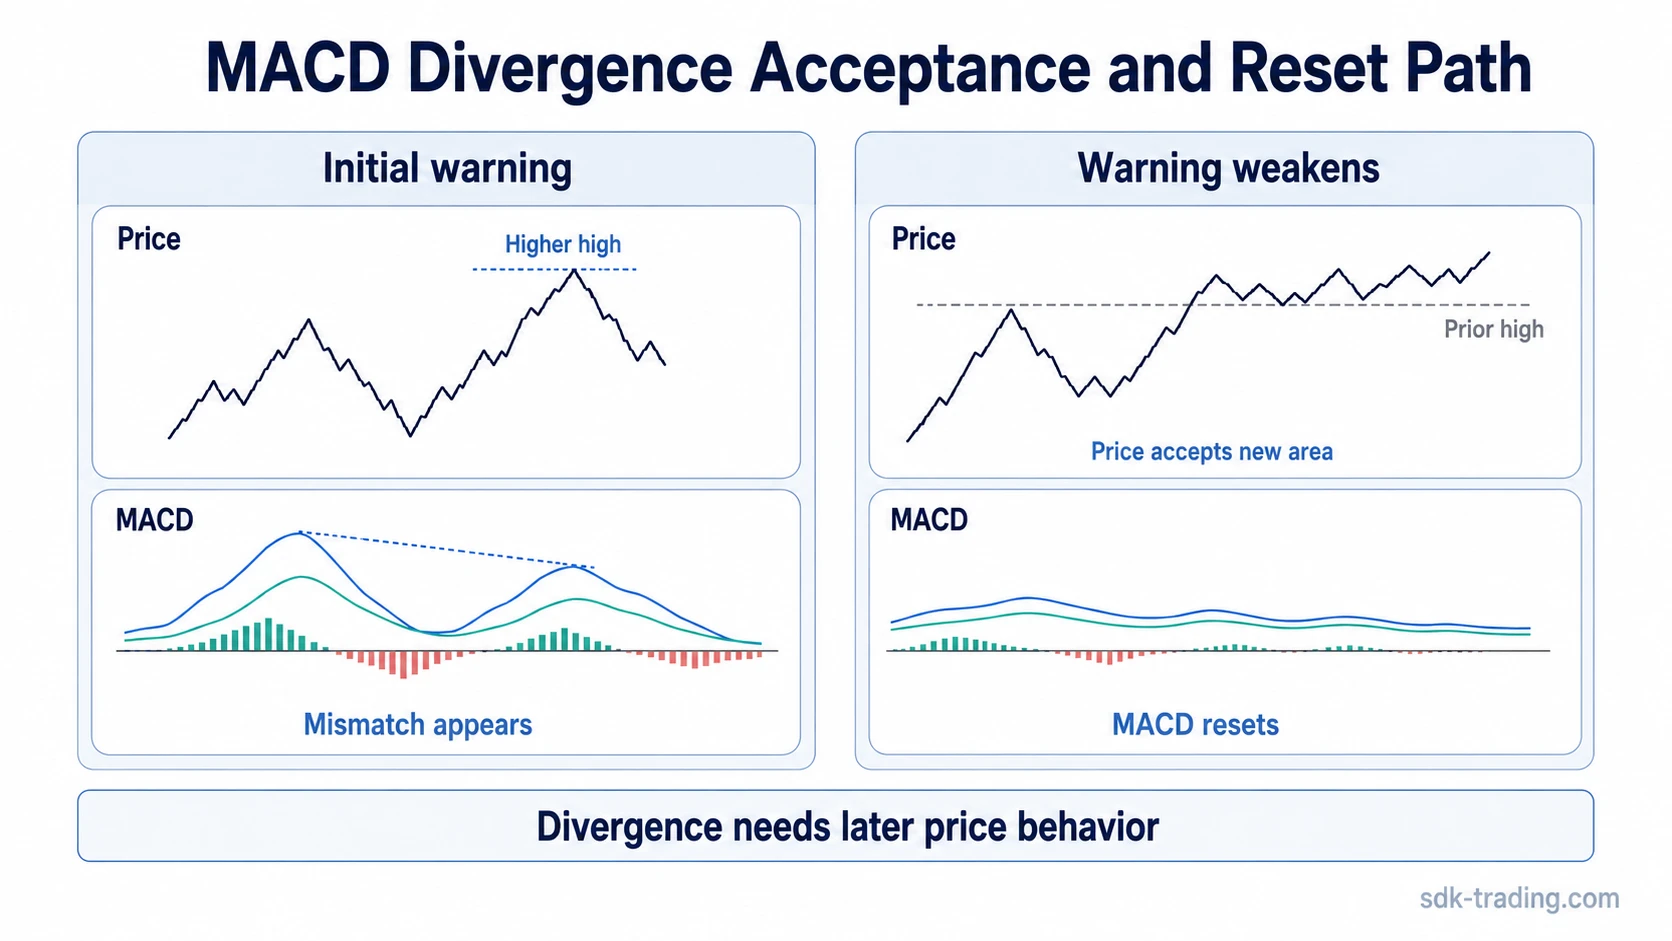
The useful distinction is between divergence existing and divergence mattering. A visible mismatch can be early, weak, or misleading if the swing points are unclear, the timeframe is inconsistent, or price accepts the new high or low while MACD resets through smoothing.
Key Points
- MACD divergence compares price swing behavior with MACD momentum behavior.
- The reading can involve the MACD line, signal-line relationship, or histogram amplitude.
- Bullish and bearish forms describe direction, but the underlying question is whether momentum confirms the price swing.
- A clean reading needs comparable pivots, matching timeframe context, and later price behavior that supports the mismatch.
- The signal can weaken when price accepts the new extreme and MACD simply resets or catches up.
What MACD Divergence Means
MACD divergence means that price and MACD are no longer moving with the same momentum profile. In a bearish case, price may push to a higher swing high while MACD forms a lower high. In a bullish case, price may fall to a lower swing low while MACD forms a higher low.
The broader concept is divergence in trading, while MACD divergence is defined by how the MACD line, signal line, and histogram respond to the moving-average spread behind the indicator. The reading is therefore not only a price-versus-indicator mismatch; it also depends on which MACD component fails to confirm the latest swing.
A divergence reading is more defensible when price makes a clear swing extreme and MACD fails to show the same expansion in momentum. It is weaker when the price swing is marginal, the MACD pivot is unclear, or the indicator difference comes mainly from smoothing noise.
How MACD Divergence Forms
MACD is built from the relationship between moving averages. The MACD line reflects the spread between a faster and slower exponential moving average. The signal line smooths the MACD line. The histogram shows the difference between the MACD line and the signal line.
Divergence forms when price expands in one direction but the MACD structure shows less force behind the move. A higher price high with a weaker MACD high can suggest that upward momentum is no longer expanding at the same rate. A lower price low with a stronger MACD low can suggest that downside momentum is no longer expanding at the same rate.
The swing comparison matters more than a single indicator print. Two price pivots should be comparable in timeframe, structure, and chart context. Two MACD pivots should also be comparable. A mismatch between a major price swing and a minor indicator wiggle is usually too weak to carry much diagnostic value.
Bullish and Bearish MACD Divergence
Bullish MACD divergence appears when price makes a lower low while MACD forms a higher low or loses downside momentum. The warning is that selling pressure may be weakening, especially if the next recovery attempt shows better acceptance and the histogram stops expanding downward.
Bullish divergence covers the broader directional pattern across different indicators. MACD adds a specific layer because the line, signal line, and histogram can each change the quality of the reading.
Bearish MACD divergence appears when price makes a higher high while MACD forms a lower high or shows weaker upside expansion. The warning is not that a reversal is guaranteed. The safer reading is that the new high has weaker MACD confirmation than the earlier swing.
MACD Line, Signal Line, and Histogram Divergence
The MACD line is usually the first component to compare against price swings. If price makes a higher high while the MACD line makes a lower high, the indicator is showing less momentum expansion than price. If price makes a lower low while the MACD line makes a higher low, downside momentum may be contracting.
The signal line helps smooth the MACD line, but that smoothing also creates lag. A signal-line relationship can support the reading when the MACD line fails to pull away cleanly, but a crossover alone is not the same as divergence. A crossover only describes the relationship between the MACD line and signal line at that moment.
The histogram can make momentum changes easier to see. Smaller histogram bars during a new price high or low can warn that the spread between the MACD line and signal line is not expanding with price. Histogram divergence is useful as supporting evidence, but it is too thin when the price pivots or MACD pivots are not clear.
For that reason, histogram contraction should support the swing comparison rather than replace it. A smaller histogram response matters more when the MACD line also fails to confirm a comparable price pivot.
Clean, Weak, and Invalid MACD Divergence
A MACD divergence reading becomes more useful when the chart separates three questions: whether the mismatch exists, whether it matters, and what would weaken it. The same visual shape can carry different meaning depending on price acceptance, pivot clarity, and MACD component behavior.
| Reading quality | What exists | What matters | What weakens or invalidates it |
|---|---|---|---|
| Clean MACD divergence | Price makes a clear new swing high or low while MACD forms a clear opposite or weaker swing. | The swing points are comparable, the timeframe matches, and later price behavior fails to confirm the new extreme. | The reading weakens if price quickly accepts the new extreme and MACD starts catching up. |
| Weak MACD divergence | Price and MACD show a possible mismatch, but the pivots are shallow, compressed, or uneven. | The chart needs stronger context because the mismatch may come from range compression or indicator smoothing. | The reading weakens if the histogram is mixed, the MACD line is flat, or the signal line only lags normal price movement. |
| Invalid MACD divergence | No real new price extreme exists, or MACD does not form a comparable pivot. | The shape does not support a valid swing-to-swing comparison. | The reading fails if price accepts the breakout or breakdown and the MACD difference was mostly settings noise. |
Why MACD Divergence Can Fail
MACD divergence can fail when the price move is accepted instead of rejected. A bearish mismatch may appear as price pushes above a prior high with weaker MACD confirmation. If price then holds above that prior high and the next pullback is shallow, the earlier warning loses force. MACD may simply reset while price continues to build acceptance.
The same logic can apply near lows. A bullish mismatch may appear as price trades below a prior low while MACD makes a higher low. If price remains below the broken area and recovery attempts stall, the divergence has not produced a stronger case. The lower area has been accepted rather than rejected.
Limitation: MACD is smoothed and setting-sensitive. A divergence shape can change when the timeframe changes, when the market moves sharply, or when the indicator parameters differ. Confirmation is a condition, not a guarantee.
MACD Divergence vs RSI Divergence
MACD divergence and RSI divergence both compare price swings with momentum behavior, but they are not built the same way. RSI is a bounded oscillator, while MACD is based on the spread between moving averages and is not bounded in the same way.
This difference changes how the signal should be read. RSI divergence often focuses on whether momentum fails to confirm price near a bounded oscillator extreme. MACD divergence focuses more on whether the moving-average spread, MACD line, signal-line relationship, and histogram response confirm the latest price swing.
A MACD mismatch can look less dramatic than RSI divergence because smoothing can delay the turn. It can also look more pronounced during strong trends because the moving-average spread can expand or contract in waves. The safer comparison is not which indicator is better, but which one gives the clearer swing-to-swing reading in the chart context being reviewed.
How to Read MACD Divergence Safely
The first step is to mark the price swings before judging the indicator. If the price pivots are not clear, the MACD comparison is already weak. The next step is to compare the MACD line and histogram at the same swing points instead of reacting to a single crossover or one shrinking histogram bar.
Price behavior has to confirm that the momentum warning is actually influencing the structure. A bearish divergence carries more diagnostic weight when a new high fails to hold and the next recovery attempt cannot regain momentum. A bullish divergence carries more weight when a new low is rejected and later selling attempts lose force.
The interpretation weakens when price accepts the new high or low. Acceptance means the market treats the new area as usable rather than rejected. In that situation, MACD divergence may have marked a pause in momentum rather than a meaningful change in direction.
Example of a Basic MACD Divergence Reading
Price advances into a prior resistance area and briefly trades above the earlier swing high. The MACD line does not make a higher high, and the histogram expands less than it did during the earlier advance. That creates a bearish MACD divergence warning.
The warning gains diagnostic value if price cannot hold above the prior high and the next recovery attempt stalls below the same area. If price stays above the prior high and pullbacks remain shallow, the MACD mismatch may only reflect a pause while the indicator resets.
The diagnostic question is not whether the divergence appeared. The better question is whether price behavior confirmed rejection or showed acceptance after the new high.
Common MACD Divergence Mistakes
A common mistake is treating every smaller histogram bar as divergence. Histogram contraction can happen during normal pauses, especially after fast moves. It becomes more useful when it lines up with a comparable price swing and a weaker MACD line response.
Another mistake is confusing divergence with a crossover. A MACD crossover can happen without a valid price swing comparison. Divergence needs two price points and two indicator points that can be compared logically.
A third mistake is ignoring timeframe alignment. A mismatch on a short timeframe may disappear on a higher timeframe, and a higher-timeframe divergence may develop long before price confirms anything locally. Mixing timeframes without a clear comparison can make the signal look cleaner than it is.
FAQ
What is MACD divergence?
MACD divergence is a trading momentum mismatch where price makes a new swing high or low, but the MACD line, signal-line relationship, or histogram does not confirm the same strength.
Is MACD divergence a reversal signal?
MACD divergence can warn that momentum is changing, but it does not prove that price will reverse. The reading needs price behavior, swing clarity, and MACD component agreement before it becomes more defensible.
Can MACD histogram divergence be enough by itself?
Histogram divergence is usually supporting evidence, not enough by itself. It is more useful when price forms comparable swing points and the MACD line also fails to confirm the latest price extreme.
Why does MACD divergence fail?
MACD divergence often fails when price accepts the new high or low instead of rejecting it. In that case, MACD may reset through smoothing while the price move continues or stabilizes.