Hidden divergence is a trading divergence pattern where price and an oscillator disagree during a pullback inside an existing trend. It can support a continuation-context reading, but it does not confirm continuation unless the relevant swing structure continues to hold.
Definition: Hidden divergence forms when price makes a higher low while the oscillator makes a lower low in an uptrend, or when price makes a lower high while the oscillator makes a higher high in a downtrend. The central idea is that price holds its trend structure while momentum appears to pull back more deeply.
Key Points
- Hidden divergence compares price swing points with oscillator swing points, not isolated candles or indicator ticks.
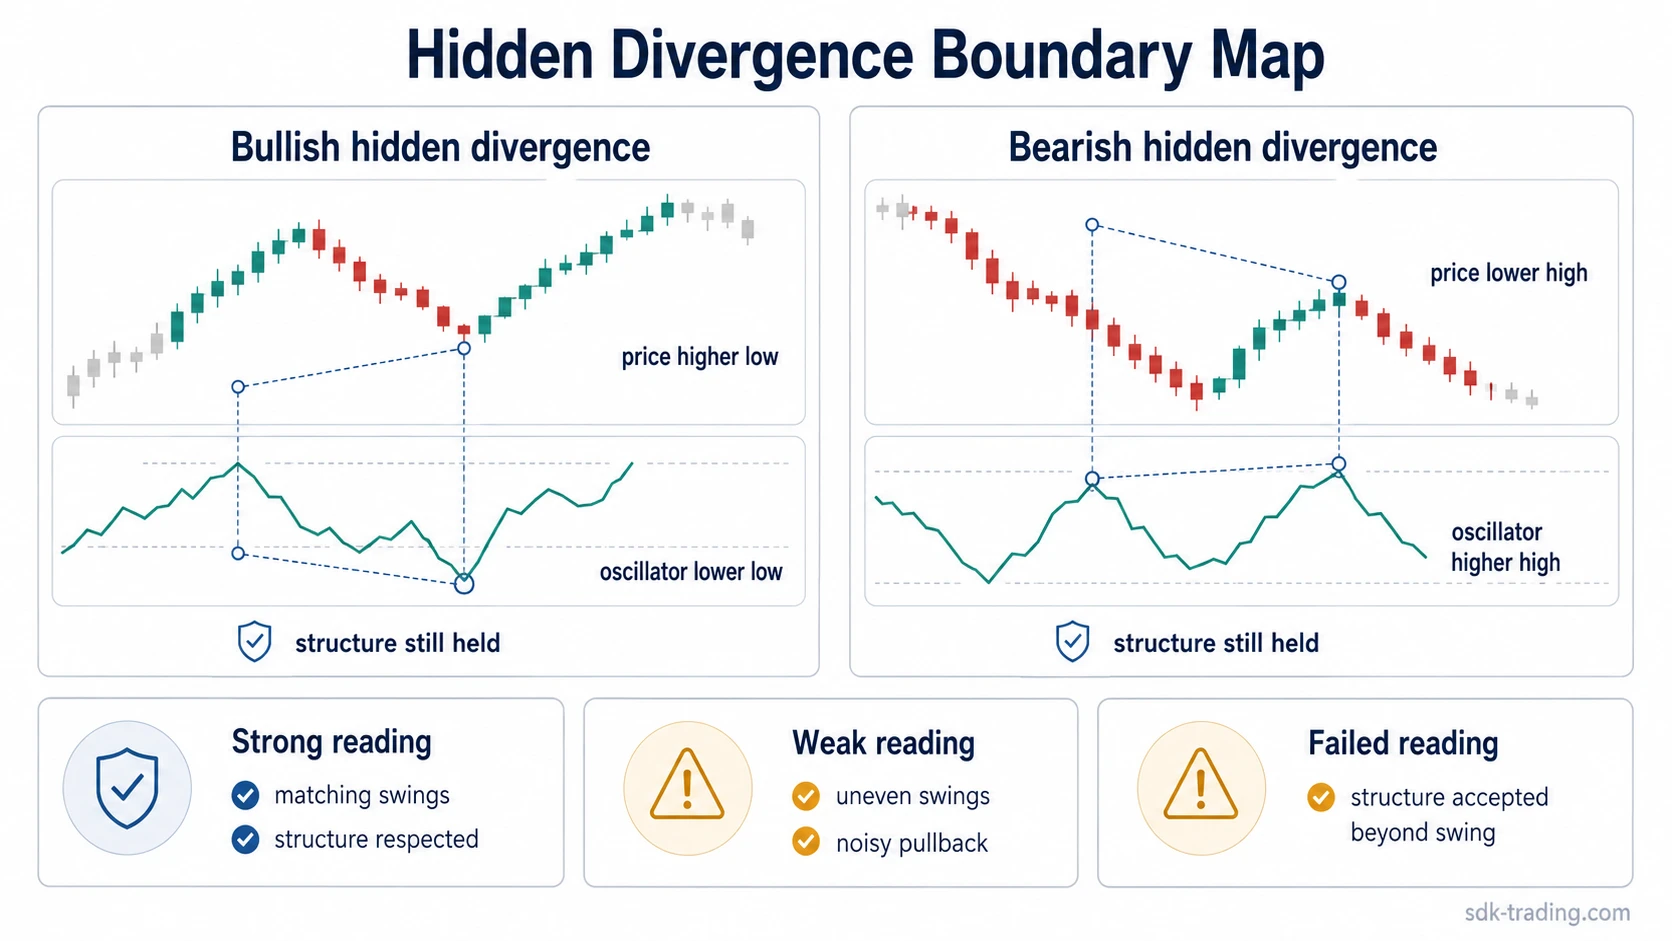
- Bullish hidden divergence uses a price higher low and an oscillator lower low.
- Bearish hidden divergence uses a price lower high and an oscillator higher high.
- The pattern has higher diagnostic value when trend structure remains intact and lower value when swings are forced, noisy, or no longer comparable.
What Is Hidden Divergence?
Hidden divergence is a momentum disagreement that appears after price has already formed a trend structure. Instead of warning that the trend may be exhausted, it compares whether a pullback in momentum is larger than the pullback in price.
In an uptrend, price may hold above a previous swing low while an oscillator drops below its previous oscillator low. In a downtrend, price may fail below a previous swing high while the oscillator rises above its previous oscillator high. In both cases, price structure is being compared with oscillator structure.
The practical boundary is simple: hidden divergence is a reading of structural disagreement, not an instruction to act. A continuation interpretation becomes more reasonable only when later price behavior continues to respect the relevant swing structure.
The Common Misunderstanding
Common misunderstanding: Hidden divergence is often treated as automatic continuation confirmation. A safer reading is that hidden divergence only suggests that price structure has held better than oscillator momentum during a pullback.
The mistake usually comes from seeing the oscillator make a sharper move and assuming that price must continue in the original trend direction. That skips the main quality check: whether the price swing and oscillator swing are comparable, and whether price still accepts the trend structure after the divergence appears.
Alternative readings can also appear nearby. A lower timeframe may show regular divergence while the higher timeframe still shows hidden divergence. The cleaner interpretation is the one tied to the most relevant swing points and the current trend structure.
Hidden Divergence vs Regular Divergence
Hidden divergence belongs to the same family as divergence in trading, but the interpretation is different. Regular divergence usually appears when price extends in the trend direction while momentum fails to confirm that extension. Hidden divergence usually appears during a pullback while price structure is still holding.
| Comparison point | Regular divergence | Hidden divergence |
|---|---|---|
| Main context | Often read in a reversal or exhaustion context. | Often read in a continuation-context pullback. |
| Price behavior | Price makes a stronger extreme than momentum supports. | Price holds trend structure while momentum pulls back more deeply. |
| Typical question | Is the current move losing momentum? | Is the pullback still contained inside the trend? |
| Main risk | Calling reversal too early. | Calling continuation before structure has held. |
Bullish and Bearish Hidden Divergence
Hidden divergence can be bullish or bearish depending on the trend direction and the swing relationship being compared. The words bullish and bearish describe the interpretation context, not a guaranteed outcome.
| Type | Price structure | Oscillator structure | Interpretation boundary |
|---|---|---|---|
| Bullish hidden divergence | Price forms a higher low. | Oscillator forms a lower low. | The uptrend pullback has not broken the relevant price swing structure. |
| Bearish hidden divergence | Price forms a lower high. | Oscillator forms a higher high. | The downtrend bounce has not reclaimed the relevant price swing structure. |
A bearish hidden divergence reading should stay separate from a broader bearish divergence discussion. The hidden version focuses on a lower-high structure during a downtrend bounce, while broader bearish divergence often refers to price pushing higher while momentum fails to confirm.
How To Identify Hidden Divergence Without Forcing It
Hidden divergence becomes unreliable when the chart is searched until two convenient points appear. The comparison needs two meaningful price swings and two related oscillator swings. The points should belong to the same timeframe and reflect the same part of the market structure.
Swing-point dependency: A hidden divergence reading is only as useful as the swing points behind it. If the price swing is clear but the oscillator swing is tiny, noisy, or taken from a different rhythm, the pattern has low diagnostic value before interpretation begins.
A clean identification process starts with price structure, not the oscillator. First, identify whether price is forming a higher-low sequence or a lower-high sequence. Then compare the oscillator swings that correspond to those price swings. If the oscillator points do not line up with the price structure, the pattern is probably being forced.
Indicator choice also matters. Oscillators can react differently to the same price movement, so an RSI reading and a MACD reading may not match perfectly. That difference does not make one reading automatically better; it means the indicator’s construction must be considered before interpreting the divergence.
Clean, Weak, and Invalid Hidden Divergence Readings
The strongest hidden divergence readings separate the raw shape from the quality of the structure around it. A price higher low plus oscillator lower low is only the starting observation. The next step is judging whether the surrounding market behavior supports, weakens, or cancels the interpretation.
| Reading quality | What the structure looks like | Why it matters | Interpretation limit |
|---|---|---|---|
| Clean | Price holds the relevant higher low or lower high while the oscillator makes the opposite swing cleanly. | The price structure and oscillator structure are comparable. | Still needs later price behavior to respect the trend structure. |
| Weak | The divergence exists, but the swings are uneven, too close together, or formed during noisy sideways movement. | The oscillator disagreement may reflect noise rather than a meaningful pullback. | The structure remains low quality until price behavior becomes clearer. |
| Invalid or failed | Price breaks and accepts beyond the swing structure that the hidden divergence depended on. | The original continuation-context interpretation no longer matches the chart structure. | The interpretation fails as a reading; no trade-stop conclusion is implied. |
Example Scenario: When Hidden Divergence Becomes Misleading
Price is moving in an uptrend and pulls back from a recent high. The pullback holds above the prior swing low, while the oscillator drops below its prior oscillator low. That creates a possible bullish hidden divergence structure.
The structure is cleaner if the price swing low is obvious, the oscillator low corresponds to the same pullback, and price later continues to hold above the relevant swing area. It becomes less reliable if the oscillator low is only a small noisy dip, if the price swing is chosen from a different rhythm, or if price later accepts below the higher-low structure.
The diagnostic point is not that continuation must follow. The useful distinction is whether price structure remains intact while momentum temporarily disagrees, or whether the supposed divergence was created by forcing unrelated swing points together.
RSI, MACD, and Indicator Dependency
Hidden divergence can be read with different oscillators, but the pattern should not become indicator-only. RSI, MACD, stochastic, and similar tools can all create divergence-style readings, yet each tool measures momentum differently.
RSI divergence often makes swing highs and lows visually clear because RSI is bounded. MACD divergence can behave differently because MACD reflects moving-average relationships rather than a bounded oscillator range.
MACD divergence should therefore be interpreted with its own structure instead of being treated as a perfect substitute for RSI. The hidden divergence idea remains the same, but the oscillator’s construction affects how clean or noisy the swing comparison appears.
FAQ
What does hidden divergence mean in trading?
Hidden divergence means price and an oscillator disagree during a pullback while the broader trend structure may still be intact. It is usually read in a continuation-context, but it does not confirm continuation by itself.
What is bullish hidden divergence?
Bullish hidden divergence forms when price makes a higher low while the oscillator makes a lower low. The reading depends on whether the higher-low structure remains valid and whether the compared swings are meaningful.
What is bearish hidden divergence?
Bearish hidden divergence forms when price makes a lower high while the oscillator makes a higher high. The reading weakens if price later reclaims and accepts above the structure that created the lower high.
Why does hidden divergence fail?
Hidden divergence fails when the swing points are not comparable, the market is too noisy, the trend context is weak, or price later breaks the structure that the continuation-context reading depended on.