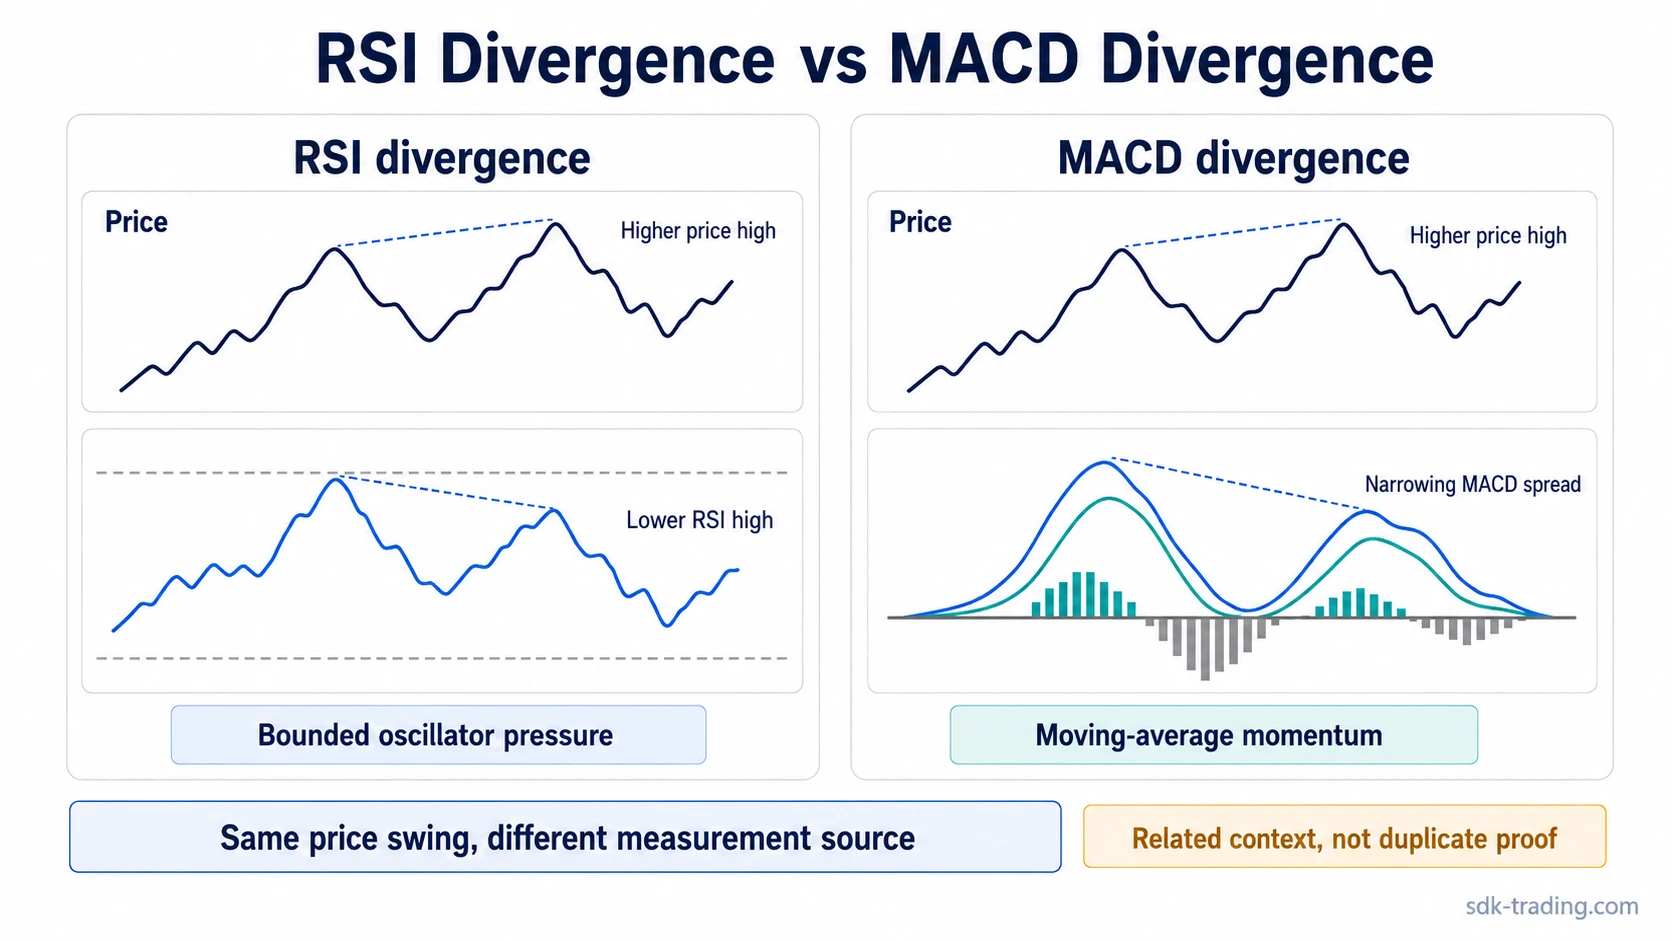
RSI divergence vs MACD divergence separates two related but different momentum readings. RSI divergence compares price swings with a bounded oscillator that reacts to recent price-change pressure, while MACD divergence compares price swings with the separation between moving averages. Both can appear during a momentum mismatch, but they should not be treated as duplicate confirmation.
Definition: RSI divergence occurs when price makes a new swing extreme but RSI does not confirm it on its bounded scale. MACD divergence occurs when price makes a new swing extreme but MACD does not confirm the same strength through its moving-average momentum structure.
Key Points
- RSI divergence compares price swings with a bounded oscillator.
- MACD divergence compares price swings with moving-average momentum.
- RSI can react earlier because it is more sensitive to recent price-change pressure.
- MACD can react later because its reading is smoothed through moving-average relationships.
- Using both can add context, but it does not turn two momentum readings into independent proof.
RSI Divergence vs MACD Divergence: The Core Difference
The core difference is measurement. RSI divergence reads disagreement between price and a bounded oscillator. That bounded scale matters because RSI can compress near high or low readings even while price continues to push slightly farther.
MACD divergence reads disagreement between price and moving-average momentum. The MACD line, signal line, and histogram are tied to the relationship between moving averages, so the reading reflects a smoother view of trend momentum rather than the most immediate pressure inside the latest swing.
False equivalence warning: RSI and MACD can both show divergence on the same chart, but they are not measuring the same failure. RSI can show pressure fading inside a fixed oscillator range. MACD can show that the moving-average spread is no longer expanding with price. Agreement between them may add context, but it is not independent proof of reversal.
Why RSI Divergence and MACD Divergence Are Confused
The confusion comes from the chart shape. Price makes a higher high or lower low, while the indicator fails to match it. The visual idea looks similar, so the two readings are often grouped together as general divergence.
The interpretation changes when the indicator design is considered. RSI is bounded between fixed levels, so its swings can flatten or compress when price keeps pushing but recent momentum no longer expands cleanly. MACD is built from moving-average relationships, so it can continue reacting to the broader trend after short-term pressure starts to fade.
That difference matters most when the chart is extended. RSI may warn earlier, but early warnings can persist while price keeps accepting new highs or lows. MACD may respond later, and that smoothing can filter some short-term noise while still lagging the first change in pressure.
RSI Divergence vs MACD Divergence Comparison Table
| Comparison point | RSI divergence | MACD divergence |
|---|---|---|
| Measurement basis | Compares price swings with a bounded momentum oscillator. | Compares price swings with moving-average momentum and spread behavior. |
| Scale | Bounded scale, usually read between fixed upper and lower zones. | Unbounded around a zero line, shaped by moving-average separation. |
| Typical speed | Often reacts earlier to changes in recent price-change pressure. | Often reacts later because moving averages smooth the signal. |
| Lag profile | Less smoothing, but more prone to early or repeated warnings. | More smoothing, but more exposed to delayed confirmation. |
| Useful context | Helpful when judging compression after an extended move or range stretch. | Helpful when judging whether trend momentum is still expanding or fading. |
| Common failure mode | The oscillator diverges early while price continues to accept new extremes. | The MACD reading lags after price has already changed character. |
| Confirmation role | Raises a momentum-quality question; does not prove rejection. | Shows trend-momentum deterioration; does not prove reversal. |
Same Price Swing, Different Indicator Message
Price advances into a prior resistance area and makes a slightly higher high. RSI fails to make a higher oscillator high because the latest upside pressure is no longer expanding cleanly inside its fixed range. That creates an RSI divergence reading.
MACD can fail for a different reason. The price high may still be marginally higher, but the moving-average spread is narrowing instead of expanding. The MACD message is not simply that recent pressure is compressed; it is that trend momentum is no longer broadening through the moving-average relationship.
The timing difference matters. RSI may flag pressure compression before MACD changes clearly, while MACD may continue reflecting the prior trend until the moving-average spread narrows enough to confirm that broader momentum has faded.
| Same chart behavior | RSI interpretation | MACD interpretation |
|---|---|---|
| Price makes a higher high. | The oscillator may compress because recent upside pressure is weaker. | The moving-average spread may narrow even while price extends. |
| The new high does not hold cleanly. | The RSI warning gains context if the market fails to accept the high. | The MACD warning gains context if trend momentum keeps narrowing after the high. |
| Price holds above the prior high. | The early warning can remain unresolved instead of immediately bearish. | The MACD reading may reset gradually if trend momentum stabilizes. |
Example reading: A higher high with lower RSI can warn that recent upside pressure is less forceful than before. A higher high with weaker MACD can warn that the broader trend impulse is no longer expanding at the same pace. The same price swing can therefore create two related warnings, but each warning comes from a different measurement source.
When RSI Divergence Gives the Cleaner Reading
RSI divergence is the cleaner diagnostic frame when the question is about recent pressure inside a bounded oscillator. It is especially relevant when price stretches into an extreme area, repeatedly tests a swing high or swing low, or pushes beyond a prior level with weaker oscillator participation.
The strength of that reading still depends on price behavior. A lower RSI high during a higher price high is only a warning until the market shows whether the new area is accepted or rejected. If price keeps holding above the prior high, the divergence may stay unresolved rather than becoming a confirmed reversal reading.
Boundary: RSI can warn early, but early does not mean correct. A market can keep trending while RSI divergence appears more than once, especially when price structure continues to accept the new direction.
When MACD Divergence Gives the Cleaner Reading
MACD divergence is the cleaner diagnostic frame when the question is about trend-momentum expansion. Because MACD is tied to moving-average relationships, it can help separate a short-lived oscillator warning from a broader loss of trend force.
The trade-off is lag. MACD may stay aligned with an existing trend longer than RSI, then shift only after momentum has already started to narrow. That smoothing can reduce some noise, but it can also delay the warning.
Boundary: MACD divergence can show that trend momentum is weakening, but weakening momentum is not the same as a completed reversal. Price structure still has to show whether the prior trend is failing, pausing, or simply resetting.
Complement or Redundancy: Should Both Be Used Together?
RSI and MACD can be used together as context, but they should not be counted as two fully independent confirmations. Both are still momentum-derived tools, even though they measure momentum through different designs.
The stronger use is diagnostic. RSI can raise the first question about pressure fading. MACD can show whether the broader moving-average impulse is also losing expansion. The weaker use is stacking both readings as if two indicators automatically confirm the same conclusion.
Complement: RSI flags compression in recent pressure while MACD also shows narrowing trend momentum.
Redundancy: both indicators are used to repeat the same momentum warning without checking price acceptance, rejection, structure, or follow-through.
Common Mistakes When Comparing RSI and MACD Divergence
| Mistake | Why it creates risk | Cleaner interpretation |
|---|---|---|
| Treating both indicators as duplicate proof | Two momentum tools can repeat the same type of evidence. | Check whether each indicator adds a different measurement insight. |
| Calling divergence a reversal signal | Divergence can persist during strong trends. | Treat divergence as a momentum-quality warning that needs price context. |
| Ignoring acceptance or rejection | A new high or low can hold even after divergence appears. | Watch whether price accepts the new area or fails back into the prior range. |
| Assuming MACD is worse because it is slower | Smoothing can delay the reading, but it can also reduce some short-term noise. | Match the indicator to the question: recent pressure or broader trend momentum. |
Limitations of Both Divergence Readings
Neither RSI divergence nor MACD divergence proves that price must reverse. Divergence can mark weakening participation, but price can continue moving if the market accepts the new level and follow-through remains intact.
A bearish divergence reading becomes more meaningful when a higher high fails to hold and later recovery attempts stall. The warning is weaker when price keeps holding above the prior high and the indicator gradually resets.
The same principle applies in continuation contexts. A hidden divergence pattern belongs to a different interpretation family because the focus is often trend continuation rather than reversal pressure. Mixing hidden divergence with regular RSI vs MACD divergence can blur the decision boundary.
Related Divergence Concepts
RSI divergence and MACD divergence are best compared through measurement basis, timing, and confirmation role. Direction-specific divergence changes the question toward the type of price failure being tested, while continuation-style divergence changes the question toward whether the prior trend is still being supported.
RSI handles bounded oscillator behavior. MACD handles moving-average momentum. Bearish divergence focuses on direction and failure risk after a higher high. Hidden divergence focuses on continuation-style mismatch. Separating those readings prevents every divergence condition from being treated as the same broad momentum warning.
FAQ
What is the main difference between RSI divergence and MACD divergence?
RSI divergence compares price swings with a bounded oscillator, while MACD divergence compares price swings with moving-average momentum. RSI often reacts faster to recent pressure, while MACD usually gives a smoother but later view of trend momentum.
Can RSI divergence and MACD divergence appear at the same time?
Yes. Both can appear during the same price swing, especially when momentum weakens while price reaches a new high or low. The readings are related, but they are not identical because RSI and MACD measure momentum differently.
Is RSI divergence better than MACD divergence?
Neither is universally better. RSI can be more sensitive to recent pressure, while MACD can provide a smoother view of trend momentum. The better lens depends on whether the question is about short-term oscillator compression or broader trend-momentum deterioration.
Does using RSI and MACD together confirm divergence?
No. Using both can add context, but it can also duplicate momentum evidence. Divergence still needs price structure, acceptance or rejection, and later behavior before the reading becomes more meaningful.