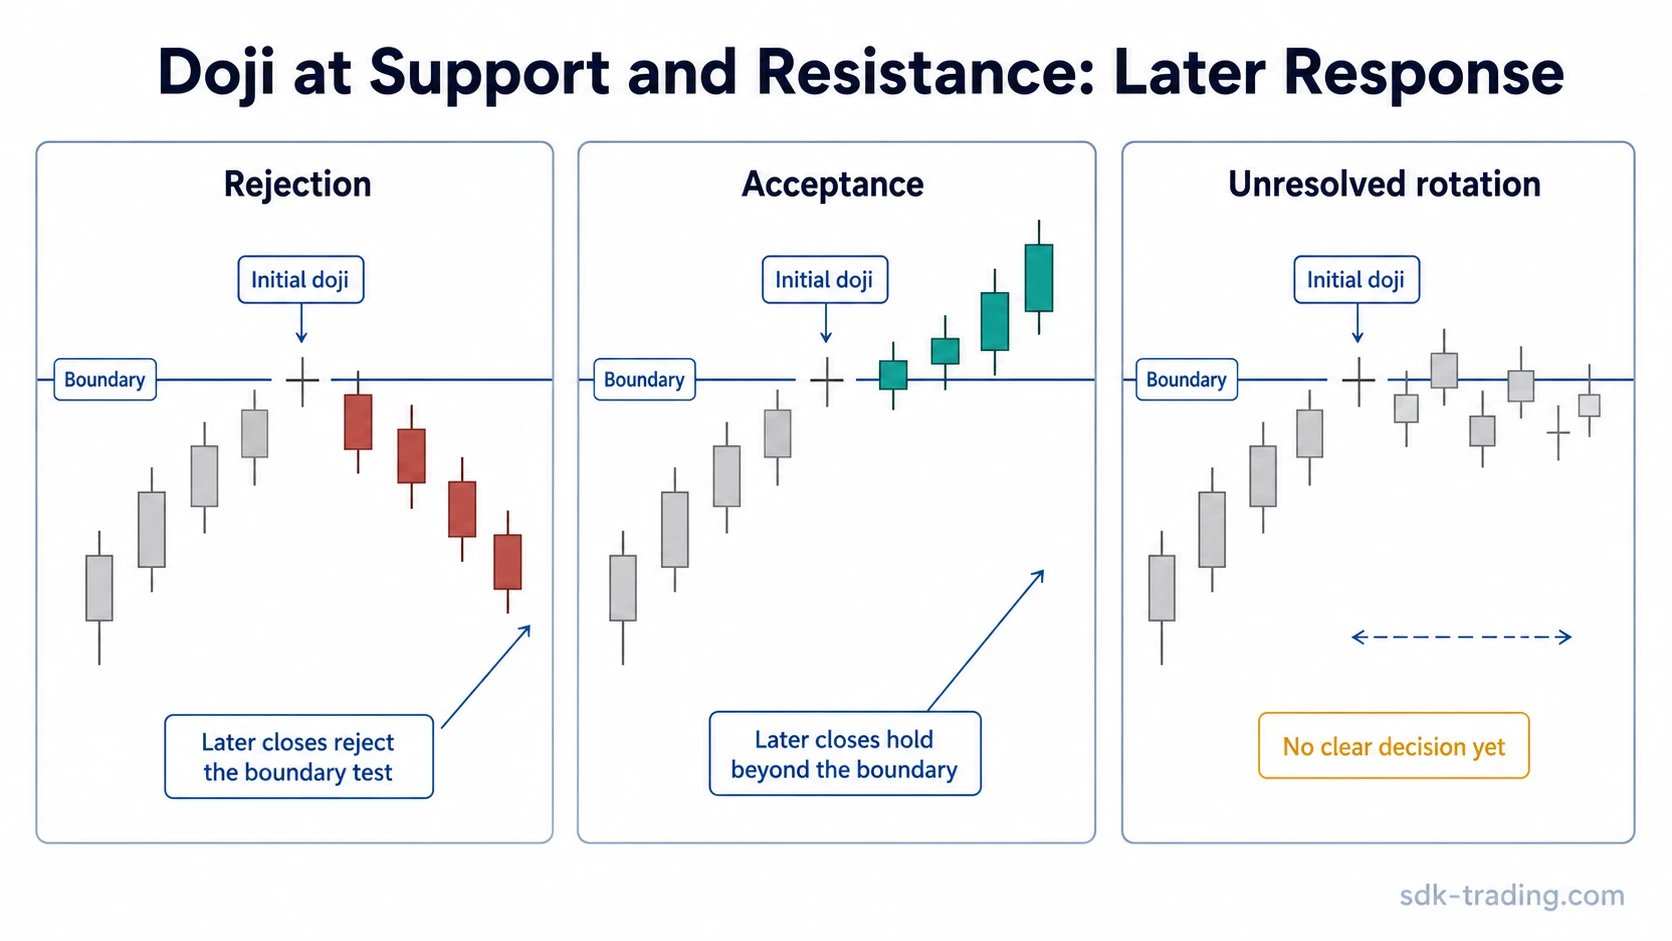
A doji at support or resistance is often misread as immediate reversal evidence. The safer reading is narrower: the candle shows balance or hesitation at a tested boundary. The interpretation changes only after later candles show rejection from the level, acceptance beyond it, or unresolved rotation around it.
A doji candle has a compressed open-close body, but the small body is only the surface feature. Near support or resistance, the more useful question is whether price treated the boundary as a limit, crossed it and accepted beyond it, or kept rotating without a clear decision.
Key Points
- A doji at support or resistance reflects temporary balance, not a confirmed reversal.
- Support-side and resistance-side readings depend on where the small body forms relative to the tested boundary.
- Broad zones reduce precision because the doji may be reacting inside a wider decision area.
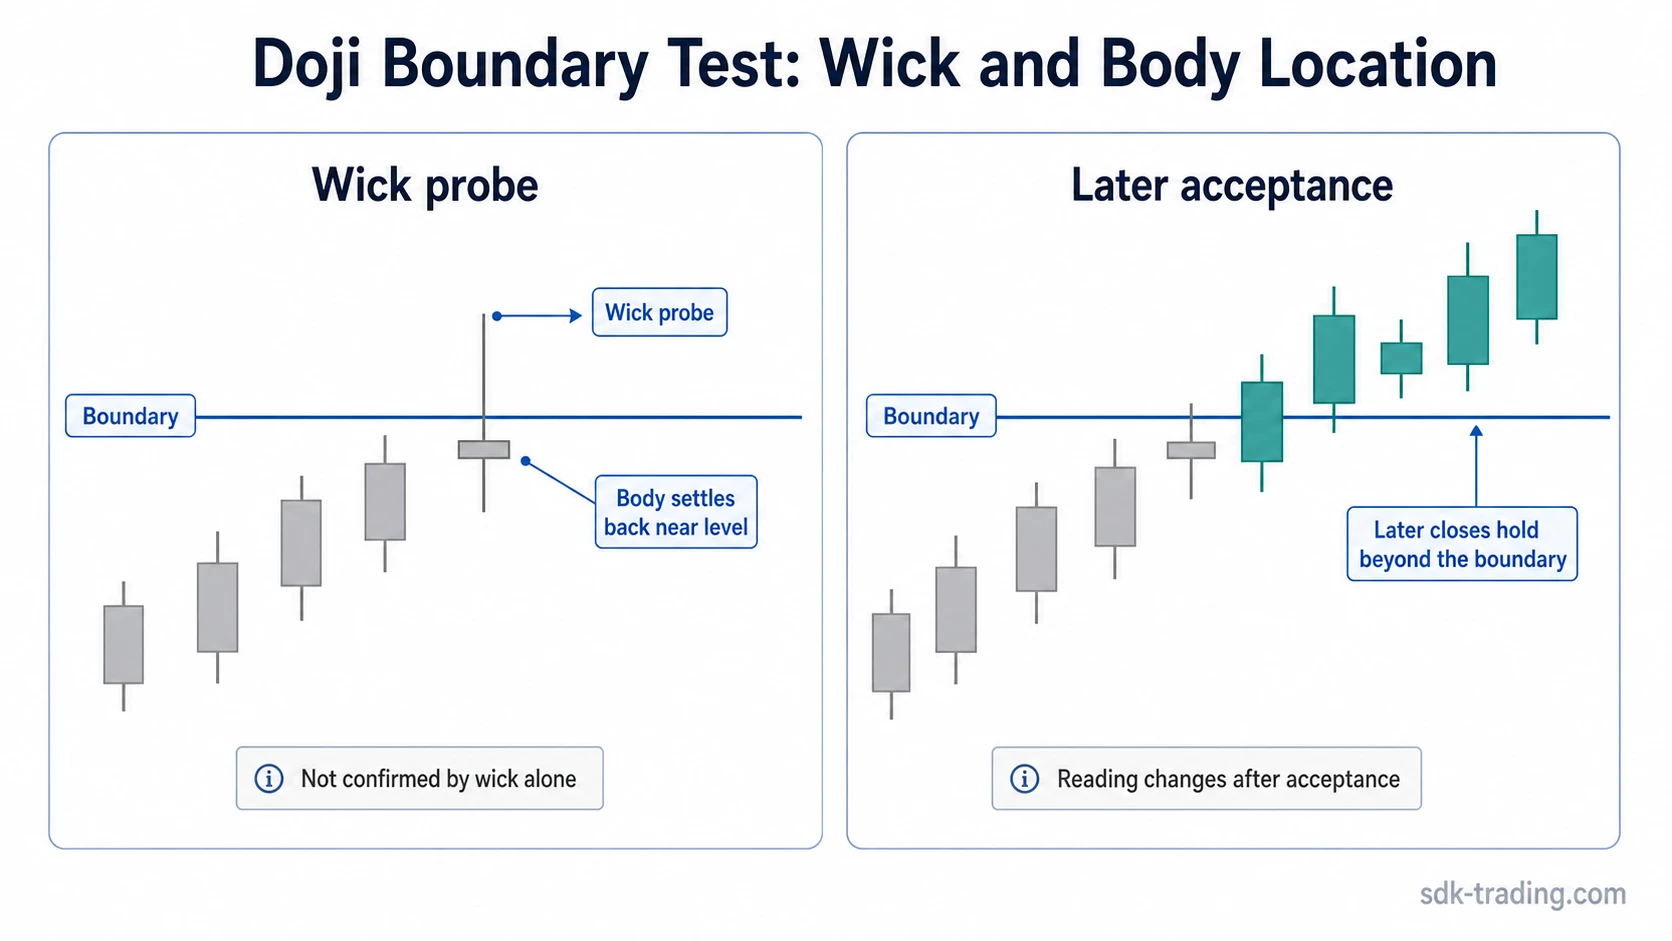
- Wick probes and body location change whether the candle suggests rejection, failed acceptance, or unresolved testing.
- Later candles decide whether the boundary mattered through rejection, acceptance beyond the level, or continued rotation.
What a Doji at Support or Resistance Means
A doji at support or resistance means price reached a known boundary and ended the candle with little separation between open and close. That can show hesitation, two-sided pressure, or a pause in directional control. It does not prove that buyers defended support or that sellers defended resistance.
The full doji candlestick family explains the compressed body itself. At a boundary, the added issue is location: the same small-body candle can mean a pause before continuation, a failed probe, or a level reaction that still needs later evidence.
Support-Side vs Resistance-Side Reading
At support, a doji can show that selling pressure slowed near a lower boundary. The reading becomes stronger only if later candles fail to sustain below that boundary and begin closing back above the tested area. A lower wick can add useful information when price probes beneath support and then returns near the body, especially when the candle resembles a dragonfly doji candle, but the shape still does not prove a durable reversal by itself.
At resistance, a doji can show that buying pressure stalled near an upper boundary. The reading becomes more meaningful when later candles fail to hold above the boundary and close back below it. If later candles accept above resistance instead, the doji loses its rejection reading and becomes part of a possible boundary transition.
Misread vs Safer Boundary Reading
| Trigger condition | Common misread | Safer boundary reading | What changes the reading |
|---|---|---|---|
| Doji prints exactly at a tested level | Reversal is confirmed | Balance appeared at a known boundary | Later candles reject, accept, or rotate around the level |
| Doji forms inside a broad zone | The reaction is precise | Balance appeared inside a wider decision area | Whether price reaches and rejects the outer edge of the zone |
| Wick pierces the boundary and closes back near it | A failed breakout is already confirmed | The probe failed to sustain immediate acceptance | Whether following candles stay back inside or reclaim the outside area |
| Doji forms before full contact with the boundary | The support or resistance reaction has already happened | Compression appeared ahead of the actual test | Whether the next candles actually test the boundary |
Sharp Level vs Broad Zone
A doji at a clean horizontal level is easier to evaluate than a doji inside a wide support or resistance zone. A sharp level gives a clearer reference for rejection or acceptance. A broad zone leaves more room for price to hesitate without making a firm decision.
When the boundary is a wide zone, a doji near the middle of the area is weaker evidence than a doji at the outer edge. The candle may only show that price slowed inside a region where previous trading activity already created uncertainty.
Wick Probe, Body Location, and Boundary Acceptance
The wick shows where price traveled during the candle. The body shows where the candle settled. Near support or resistance, the distance between the wick extreme, the body, and the boundary can change the reading.
A wick through support with a close back above it can show that lower prices failed to hold during that candle. That is not the same as confirmed rejection. The rejection reading becomes more defensible only if later candles remain above the boundary instead of accepting below it.
A wick through resistance with a close back below it can show that higher prices failed to hold during that candle. If the next candles close above resistance and keep trading there, the earlier wick no longer supports a clean rejection reading. Acceptance beyond the level changes the boundary from a possible limit into a tested area that price may be trying to absorb.
Pre-Contact Compression vs Post-Contact Hesitation
Not every doji near a boundary is a boundary reaction. A doji that forms just before price touches support or resistance can show compression ahead of the test. The market has slowed, but the actual interaction with the level has not happened yet.
Post-contact hesitation is different. Price has already reached or pierced the boundary, then closed with a compressed body. That gives the doji more relevance because the candle is tied to the tested area, but the later response still decides whether the test produced rejection, acceptance, or no usable information.
When the Boundary Reading Weakens
The reading weakens when the boundary itself is unclear. Thin trading, overlapping candles, muted volatility, or a very wide zone can make the doji look more important than it is. A small body inside noisy price action may only show temporary balance, not meaningful defense of a level.
The reading also weakens when later candles accept beyond the boundary. A doji at support loses its support-defense reading if price begins closing below the level and holding there. A doji at resistance loses its resistance-rejection reading if price begins closing above the level and holding there.
Short Illustrative Scenario
Price declines into a support zone that has been tested several times. A doji forms near the lower edge after a brief move below the zone, then closes back inside it. At that point, the candle only shows that lower prices did not hold during that interval.
If later candles close above the zone and stop revisiting the lower edge, the rejection reading becomes more defensible. If later candles close below the zone and remain there, acceptance below support changes the interpretation. If price keeps rotating through the same area, the doji remains unresolved rather than becoming clear reversal evidence.
FAQ
Is a doji at support bullish?
A doji at support can show hesitation after price tests a lower boundary, but it is not automatically bullish. The reading strengthens only if later candles fail to sustain below support and begin closing back above the tested area.
Is a doji at resistance bearish?
A doji at resistance can show that upward pressure stalled near an upper boundary, but it is not automatically bearish. If later candles accept above resistance, the rejection reading weakens.
Does a wick through support or resistance confirm rejection?
No. A wick through a boundary only shows that price tested beyond it during the candle and did not settle there. Rejection becomes clearer only if following candles fail to accept beyond that boundary.
Why is a broad support or resistance zone harder to read?
A broad zone gives price more room to hesitate without making a clear decision. A doji inside the zone may show balance, but it may not identify the exact point where buyers or sellers changed behavior.