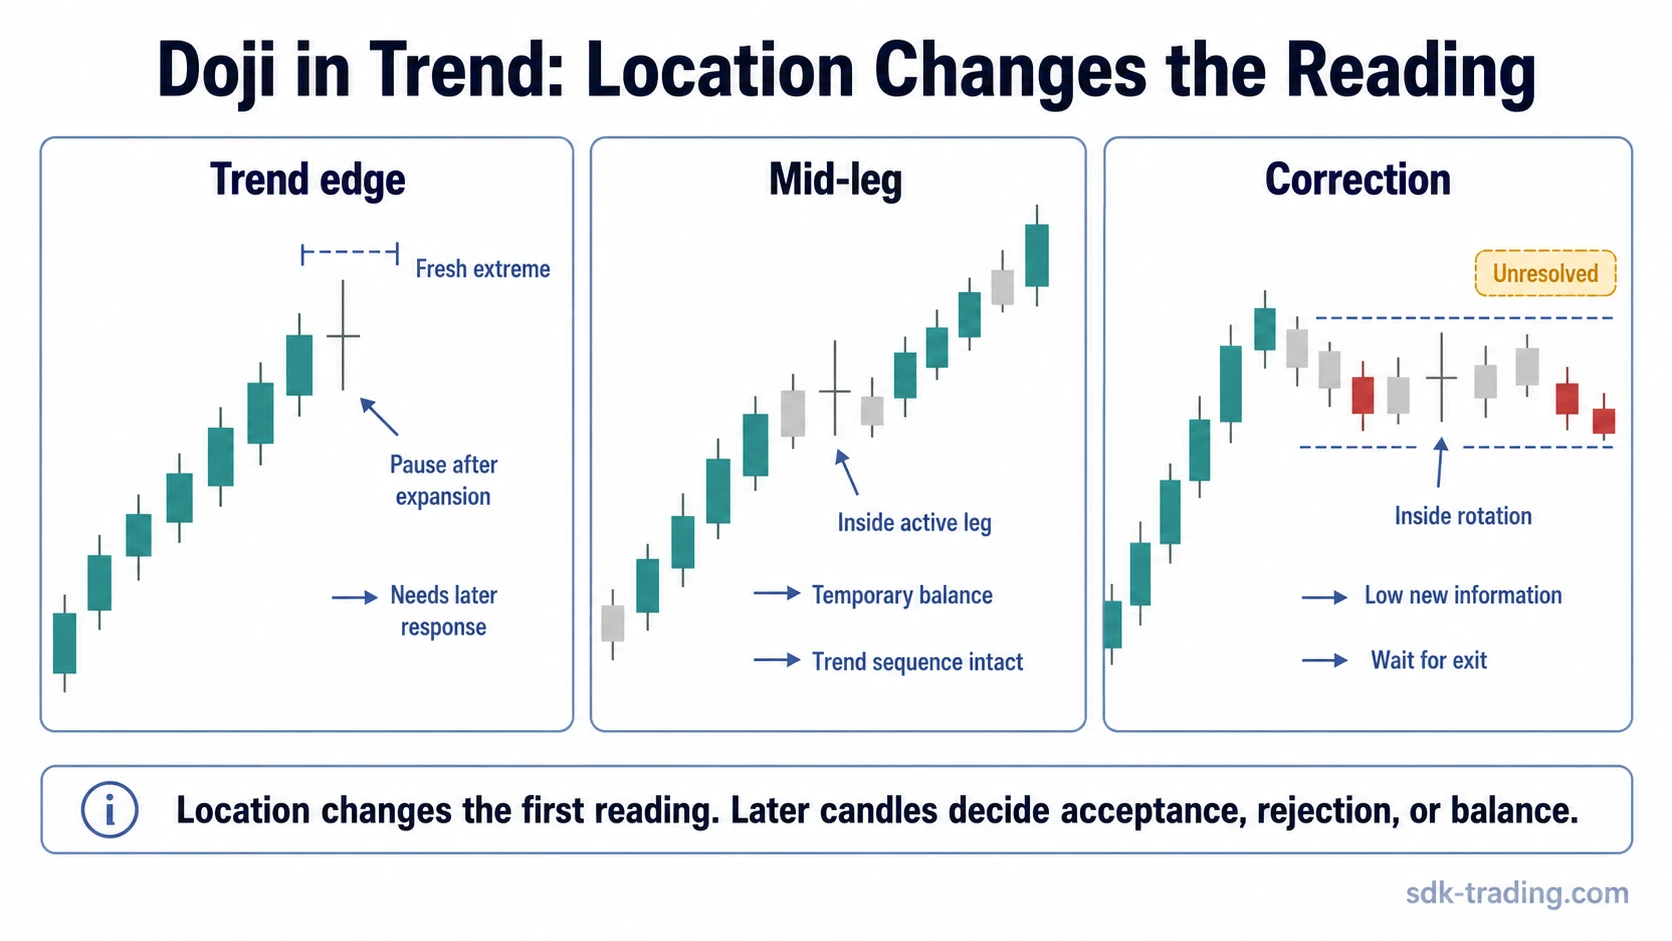
A doji in a trading trend does not automatically mean reversal. Its meaning changes by location: near the edge of a trend expansion, in the middle of an active leg, or inside an already corrective phase.
The useful question is not only whether the candle has a small body. The stronger question is where that pause appears relative to the trend sequence. A small indecision candle after a sharp push into fresh territory carries a different message from the same candle printed halfway through a steady move.
Key Points
- A trend-edge doji is more visible because it appears after expansion into a new extreme.
- A mid-leg doji often reflects temporary balance unless the broader swing structure starts to fail.
- A doji inside a correction may only show rotation inside the pullback, not a completed reversal.
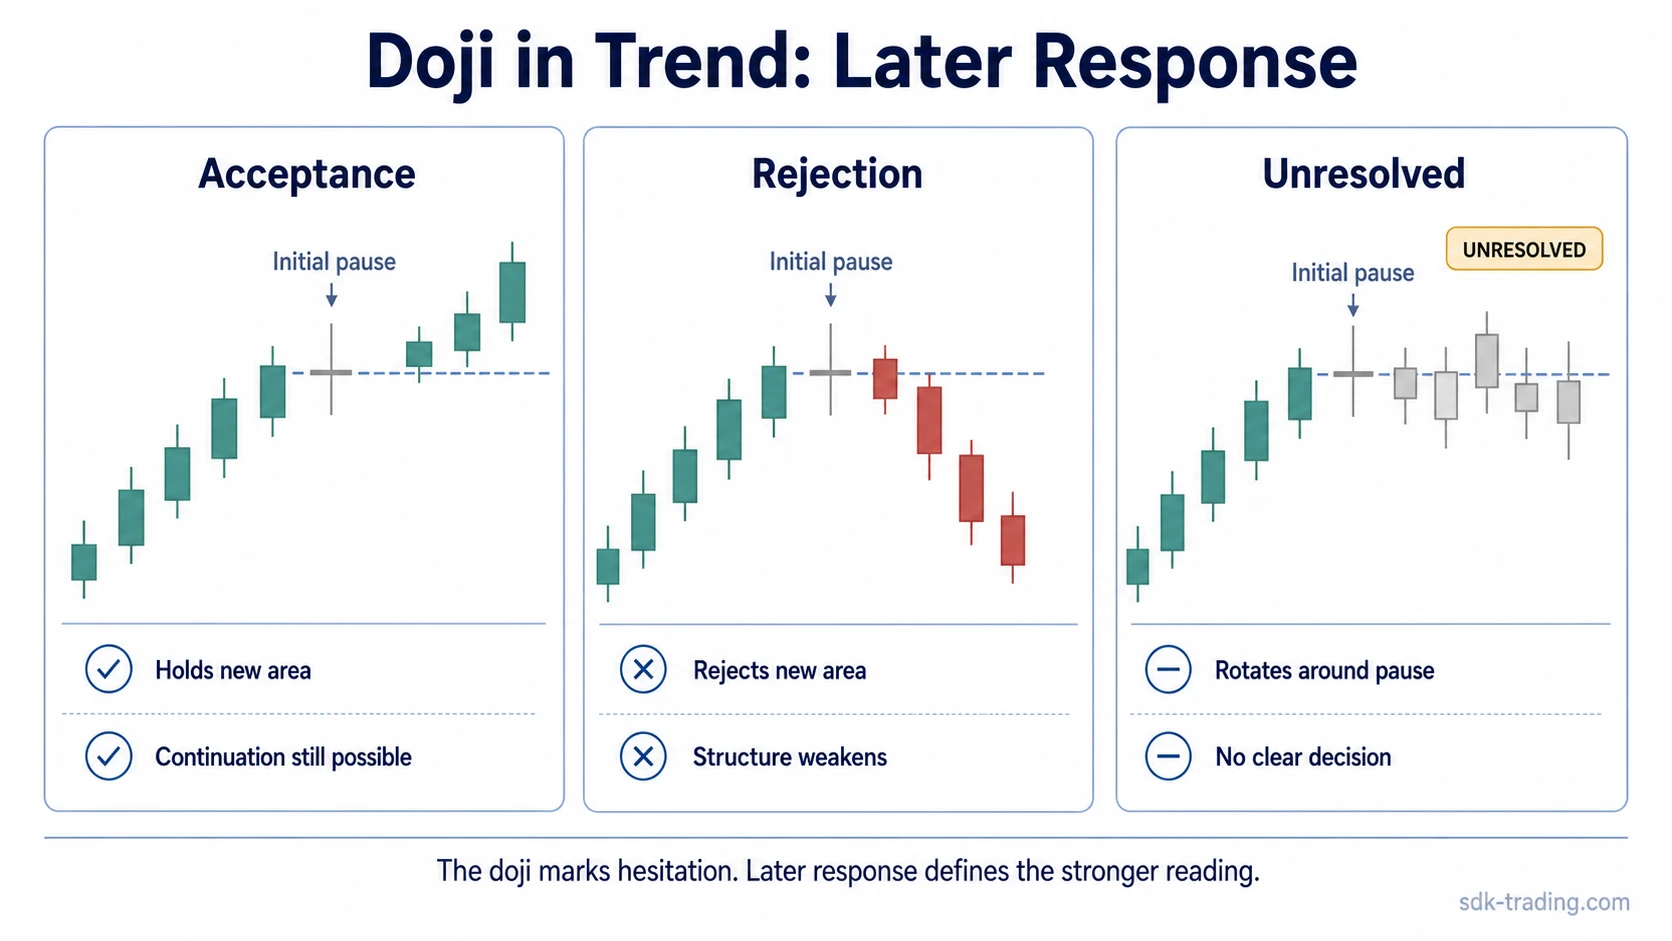
- Later candles reveal whether the pause develops into continuation, rejection, or unresolved balance.
What a Doji Means Inside a Trend
A basic doji candle forms when the open and close settle close together. That small body shows reduced directional commitment during that candle, but it does not explain the trend by itself.
Inside a trend, the candle must be read against the active sequence. In an uptrend, higher highs and higher lows show that buyers still control the broader structure. In a downtrend, lower lows and lower highs show that sellers still hold the main pressure. A single doji is only a pause until price behavior around the next candles changes that sequence.
The mistake is treating the candle shape as the full message. The same doji can mark temporary hesitation, early exhaustion, failed continuation, or simple compression before the next leg. Location shapes which reading deserves attention first.
Trend-Edge Doji vs Mid-Leg Doji
A trend-edge doji appears after price has already expanded into a new high in an uptrend or a new low in a downtrend. That location makes the candle more important because the market has just tested the outer edge of the move. The pause may show that the trend is no longer expanding cleanly, but later behavior still has to confirm whether the move is being rejected or merely resting.
A mid-leg doji has a weaker message. If price is still holding the broader sequence and the candle appears inside a steady move, the pause may only show short-term balance. Calling that candle exhaustion too early can create a false reversal reading while the larger trend remains intact.
The difference is structural. A doji at the edge asks whether expansion is still being accepted. A doji in the middle asks whether temporary balance is enough to disturb the trend. Those are not the same question.
| Location | Initial reading | What needs to happen next |
|---|---|---|
| After a fresh trend extreme | Expansion has paused at the outer edge of the move | Watch whether price accepts the new area or rejects it |
| Inside the middle of the trend leg | Short-term balance inside an active sequence | Check whether the higher-high / higher-low or lower-low / lower-high rhythm remains intact |
| Inside a corrective phase | Balance inside rotation, not automatic trend change | Wait for continuation, rejection, or a structural break |
Not This, Instead This
| Not this | Instead this |
|---|---|
| Treating every doji in a trend as reversal evidence | Separate an edge-of-expansion doji from mid-leg balance |
| Reading a mid-leg doji as major exhaustion | Check whether the broader higher-high / higher-low or lower-low / lower-high sequence remains intact |
| Treating a doji after an impulse as confirmation by itself | Wait for later candles to show continuation, rejection, or structural change |
| Ignoring corrective context | A doji inside a correction may only show balance inside an already rotational phase |
Doji After a Strong Expansion Leg
When price moves strongly in one direction and then prints a doji near the new extreme, the candle marks a pause after effort. That can matter because aggressive expansion has stopped, at least temporarily. Still, a pause is not the same as failure.
The next candles reveal the quality of the read. If price holds near the new area and continues in the trend direction, the doji may have been only a brief balance point. If price rejects the new area and closes back through prior short-term structure, the doji becomes part of a weaker expansion sequence.
A doji near a fresh high in an uptrend is therefore not automatically bearish. A doji near a fresh low in a downtrend is not automatically bullish. The candle becomes more useful when the next candles reveal whether the new area was accepted, rejected, or left unresolved.
Doji in the Middle of a Trend Leg
A mid-leg doji is easier to overread. Price may pause because short-term traders reduce activity, volatility compresses, or orders temporarily balance. None of that cancels the trend sequence by itself.
In an uptrend, the more important test is whether price keeps holding higher lows after the pause. In a downtrend, the test is whether rallies keep failing below prior swing highs. If that structure remains intact, the doji is usually secondary evidence rather than a reversal trigger.
This is where candle shape and market structure must be separated. The candle can warn that momentum is pausing. The trend sequence shows whether that warning is meaningful or just noise inside the move.
Doji Inside a Correction
A doji inside a correction often reflects uncertainty inside rotation. That is different from a doji appearing after clean trend expansion. In a correction, overlapping candles and reduced directional clarity are already part of the environment, so one more indecision candle may add little new information.
The useful read comes from what happens after the correction. If price resumes the prior trend with stronger candles and cleaner closes, the doji was only part of the pullback. If the correction deepens, breaks prior structure, and fails to recover, the same doji becomes part of a broader weakening process.
Corrective context also changes how variants are read. A dragonfly doji variant inside a pullback can look visually meaningful, but its location and later response still matter more than the label.
Simple Doji in Trend Example
Price advances through several candles and makes a fresh high after a strong expansion leg. The next candle forms a doji with a small body near the top of the move. The tempting read is immediate exhaustion because the trend stopped expanding for one candle.
That read is incomplete. A stronger bearish reading would need later candles to reject the new high, close back into the prior range, and weaken the higher-low sequence. A weaker bearish reading appears if price holds near the high, absorbs the pause, and continues upward.
The same logic applies in a downtrend. A doji after a fresh low becomes more important if sellers fail to keep price below the new area. If price accepts the lower area and continues downward, the pause did not reverse the trend.
What Matters More Than the Doji Itself
The doji is only one observation. The stronger reading comes from the interaction between candle location, trend structure, close location, volatility, and the next response.
| Factor | Why it matters |
|---|---|
| Trend sequence | Shows whether the broader structure is still intact |
| Location in the move | Separates an edge pause from ordinary mid-leg balance |
| Later candle response | Shows whether price accepts, rejects, or rotates around the doji area |
| Correction quality | Shows whether the doji appears inside normal pullback behavior or a deeper structural change |
A doji becomes more useful when these factors point in the same direction. If they conflict, the safer reading is unresolved balance rather than a forced reversal or continuation call.
FAQ
Does a doji in a trend mean reversal?
No. A doji in a trading trend shows a pause in directional commitment during that candle. Reversal becomes more defensible only if later candles reject the trend extreme or break the broader trend sequence.
Is a mid-leg doji important?
A mid-leg doji is usually less important than a doji near a fresh trend extreme. If the broader trend structure remains intact, the candle may only show temporary balance.
What matters more: the doji or the trend sequence?
The trend sequence matters more. The doji can highlight hesitation, but higher highs and higher lows in an uptrend, or lower lows and lower highs in a downtrend, show whether the structure is changing.
Can a doji in a correction mean continuation?
It can, but not by itself. A doji inside a correction may only show balance. Continuation becomes stronger if price exits the corrective phase and resumes the prior trend with cleaner closes.