Bollinger Bandwidth is a Bollinger Bands-derived measure of the distance between the upper and lower bands, usually expressed relative to the middle band. It shows whether the envelope around price is narrowing or widening, which makes it useful for reading relative volatility contraction and expansion. It does not identify direction by itself.
The useful reading is not the raw number alone. A low value can describe compression only when it is low relative to the same instrument, timeframe, and settings. A high value can describe expansion, but it still does not say whether price pressure is sustainable, directional, or already exhausted.
Key Points
- Bollinger Bandwidth measures the width of the Bollinger Bands envelope, not where price sits inside that envelope.
- The standard formula compares the upper-lower band distance with the middle band, and some platforms multiply the result by 100.
- Narrow bandwidth can describe volatility compression, while wide bandwidth can describe volatility expansion.
- Bandwidth readings are relative to the instrument, timeframe, lookback length, standard deviation multiplier, and platform calculation method.
What Is Bollinger Bandwidth?
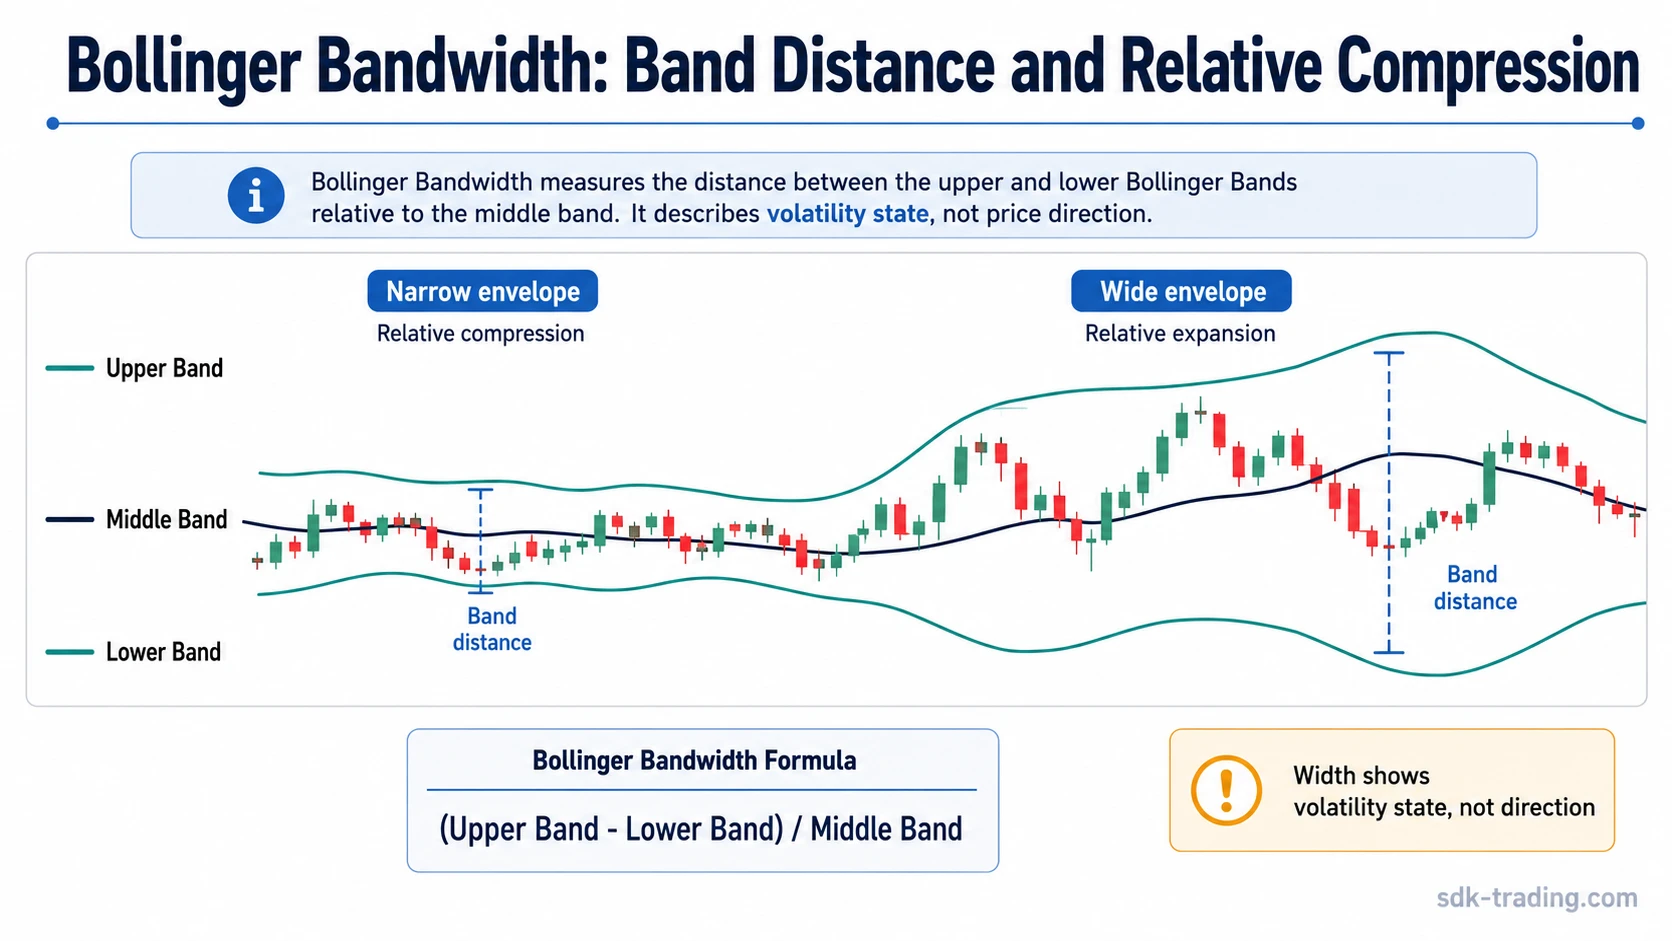
Bollinger Bandwidth is a volatility-width indicator derived from Bollinger Bands envelope structure. Bollinger Bands place an upper band and a lower band around a middle moving average. Bollinger Bandwidth converts the distance between those bands into a single value.
When the bands move closer together, Bandwidth falls. When the bands move farther apart, Bandwidth rises. The indicator therefore describes the width of the envelope, not the location of price inside the envelope and not the future direction of price.
Definition: Bollinger Bandwidth measures how wide the upper and lower Bollinger Bands are relative to the middle band. It is mainly used to compare periods of relative compression and expansion in the same market context.
Bollinger Bandwidth Formula
The common Bollinger Bandwidth formula is:
Bollinger Bandwidth = (Upper Bollinger Band – Lower Bollinger Band) / Middle Bollinger Band
Some charting platforms multiply the result by 100 so the value appears as a percentage. The reading may also vary slightly across platforms if the moving average type, lookback length, price basis, or standard deviation calculation differs.
| Formula component | Role in the calculation |
|---|---|
| Upper Bollinger Band | The upper boundary of the volatility envelope. |
| Lower Bollinger Band | The lower boundary of the volatility envelope. |
| Middle band | The moving-average baseline used as the denominator. |
| Lookback length | The period used to calculate the moving average and dispersion. |
| Standard deviation multiplier | The setting that controls how far the bands are placed from the middle band. |
The denominator matters because it normalizes the band distance against the middle band. Without that normalization, the width would be harder to compare across different price levels.
What Bollinger Bandwidth Shows
Bollinger Bandwidth shows the relative expansion or contraction of the Bollinger Bands envelope. A falling reading means the upper and lower bands are moving closer together. A rising reading means the band distance is increasing.
A narrow reading can indicate that recent price dispersion has declined. This is often described as compression, but the reading should be judged against the same instrument’s recent history rather than against a fixed universal level.
A wide reading can indicate that recent dispersion has increased. That expansion can appear during strong directional movement, volatile two-sided movement, post-news instability, or a move that is already losing follow-through. Bandwidth alone does not separate those cases.
Reading boundary: Bollinger Bandwidth is most useful as a volatility-state measure. It helps classify whether the envelope is relatively narrow, normal, or wide. It does not decide whether price should continue, reverse, break out, or mean-revert.
Narrow Bandwidth, Wide Bandwidth, and Relative Thresholds
Narrow Bollinger Bandwidth means the bands are closer together than they were during a broader comparison window. The important word is relative. A value that looks narrow on one stock, currency pair, crypto asset, or timeframe may be normal on another.
Wide Bollinger Bandwidth means the envelope has expanded. Expansion can follow a directional push, a volatility shock, a gap, or unstable price movement. The indicator can show that the range environment has changed, but the price structure must still show whether the expansion is accepted or fades.
Thresholds become unreliable when they are copied across markets without context. A narrow reading is more meaningful when it is low compared with that same instrument’s recent Bandwidth range. A wide reading is more meaningful when it clearly separates from the instrument’s normal volatility behavior.
| Bandwidth state | What it can show | What would weaken the reading |
|---|---|---|
| Narrow | Relative compression in the band envelope. | The value is only low compared with another asset, not with its own recent range. |
| Normal | No obvious compression or expansion shift. | The reading is forced into a squeeze narrative without a clear contraction. |
| Wide | Relative expansion in band distance. | Expansion appears after a one-bar shock and then quickly fades. |
Bollinger Bandwidth and Squeeze Readings
Low Bollinger Bandwidth is often associated with a Bollinger Band Squeeze, because squeeze conditions depend on a visibly contracted band envelope. The relationship is useful, but it should not be shortened into “low bandwidth means a breakout is coming.”
A squeeze reading describes a compressed volatility state. It does not identify the direction of a later move, the quality of follow-through, or whether the first move outside the bands will persist. The later price behavior is separate from the width measurement.
False-positive scenario: A market can show low Bollinger Bandwidth, briefly move outside one band, and then return inside the envelope. In that case, the earlier compression was real, but the later expansion did not develop into sustained follow-through.
Clean, Weak, and Invalid Bollinger Bandwidth Readings
A cleaner Bollinger Bandwidth reading starts with a clear width condition and then stays within its proper boundary. The indicator describes the envelope state. It becomes more useful when the market later shows whether compression is resolving into sustained expansion or fading back into the prior range.
| Diagnostic question | Useful answer |
|---|---|
| What it is | A normalized measure of Bollinger Bands envelope width. |
| What it is not | A standalone direction, reversal, continuation, entry, or exit tool. |
| What supports the reading | The value is clearly low or high compared with the same market’s recent Bandwidth range. |
| What invalidates the reading | The supposed compression or expansion disappears when settings, timeframe, or recent history are checked. |
A weak reading often comes from forcing a fixed number onto every chart. If one asset naturally has wider bands than another, the raw value may not carry the same meaning. If a short timeframe contracts while a higher timeframe remains unstable, the compression reading may be too narrow to support a broader conclusion.
An invalid reading occurs when the indicator is asked to answer the wrong question. Bandwidth can describe that the envelope is tight or wide. It cannot prove accumulation, distribution, trend strength, reversal pressure, or breakout quality without other evidence.
Bollinger Bandwidth vs Related Volatility Tools
Bollinger Bandwidth is easiest to understand when it is separated from nearby tools. Many mistakes come from treating every Bollinger-related measure as if it answers the same question.
| Tool | Main question it answers | What it does not decide |
|---|---|---|
| Bollinger Bandwidth | How wide are the bands relative to the middle band? | Price direction or follow-through quality. |
| Bollinger Bands | Where are the upper, middle, and lower envelope boundaries? | Whether a single touch is a complete market reading. |
| Bollinger %B | Where is price located relative to the bands? | How wide the band envelope is. |
| Bollinger Band Squeeze | When unusually narrow bands are interpreted as a compression condition. | Direction, breakout quality, or trade timing by itself. |
| ATR | How large is true range, including gap-aware range behavior? | How far Bollinger Bands are from their middle band. |
| Donchian Channels | Where are the highest-high and lowest-low channel boundaries? | Standard-deviation-based band width. |
Bollinger Bandwidth and Bollinger %B are especially easy to confuse. Bandwidth measures the distance between the bands. %B measures price position inside or outside the bands. A market can have low Bandwidth while price sits near the middle band, or high Bandwidth while price is near an outer band.
Settings and Parameter Sensitivity
Bollinger Bandwidth changes when the underlying Bollinger Bands settings change. A shorter lookback usually reacts faster, while a longer lookback usually smooths the reading. A larger standard deviation multiplier widens the bands and can raise the Bandwidth value.
The price basis also matters. A calculation based on closing prices may differ from one using another input. Platform implementation can also affect the displayed result, especially when the value is shown as a decimal on one platform and as a percentage on another.
Settings note: A Bandwidth reading is only comparable when the same calculation settings are used. Changing the lookback length, standard deviation multiplier, or moving-average basis changes the measurement environment.
Common Mistakes When Reading Bollinger Bandwidth
The first mistake is treating low Bandwidth as a promise of a large directional move. Low Bandwidth describes a compressed envelope. Direction and follow-through still require separate price behavior.
The second mistake is treating expansion as directional proof. A rising Bandwidth value can appear during an upward move, a downward move, or a volatile two-sided sequence. The indicator shows expansion, not bullish or bearish control.
The third mistake is comparing raw Bandwidth values across unrelated markets. A value that looks elevated on one instrument may be ordinary on another. The safer comparison is the current value against the same instrument’s own recent range.
The fourth mistake is ignoring settings. A squeeze-like reading can disappear when the lookback length or standard deviation multiplier changes. That does not mean the indicator is broken. It means the measurement is parameter-dependent.
Practical Use Boundary
Bollinger Bandwidth can support volatility context by showing when the band envelope has become unusually tight or unusually wide. It can also help describe periods when the envelope contracts before later expansion appears.
Its practical role is narrower: Bandwidth can organize the volatility state before other evidence is reviewed. It should remain a measurement layer, not the part of the process that decides direction, trade quality, or probability.
A practical sequence is to read Bandwidth first as a measurement, then compare it against the same instrument’s recent range, then separate the volatility state from the later price response. That keeps the indicator from being used as a prediction device.
FAQ
What is Bollinger Bandwidth?
Bollinger Bandwidth is a measure of the distance between the upper and lower Bollinger Bands, usually divided by the middle band. It shows whether the band envelope is relatively narrow or wide.
What is the Bollinger Bandwidth formula?
The common formula is upper Bollinger Band minus lower Bollinger Band, divided by the middle Bollinger Band. Some platforms multiply the result by 100 to display it as a percentage.
Does low Bollinger Bandwidth predict a breakout?
Low Bollinger Bandwidth can describe volatility compression, but it does not predict direction or guarantee a breakout. A later move still needs separate follow-through and structure.
How is Bollinger Bandwidth different from Bollinger %B?
Bollinger Bandwidth measures how far apart the bands are. Bollinger %B measures where price is positioned relative to the bands.