A Bollinger Band Squeeze is a condition where Bollinger Bands narrow around price because recent volatility or price dispersion has contracted. It shows compression in the bands, not the future direction of price.
The useful question is whether the narrowing is visible, measurable, and still valid. A squeeze can appear before a later expansion in movement, but the squeeze itself does not say whether that move must be upward, downward, immediate, or clean.
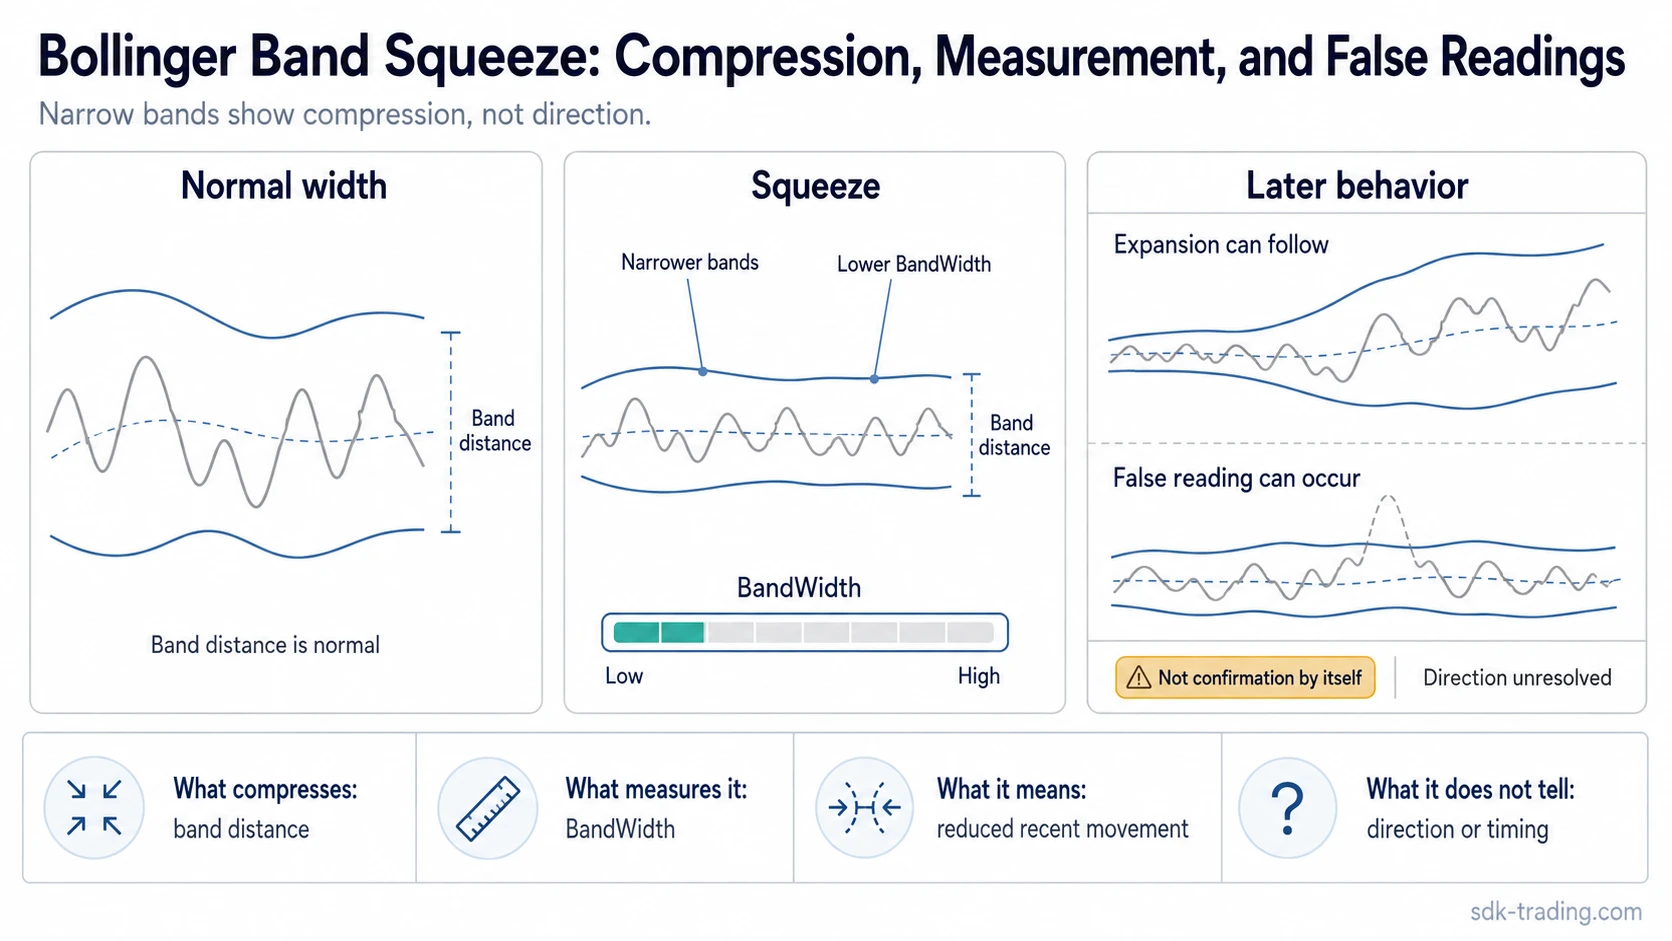
- What compresses: the distance between the upper and lower Bollinger Bands.
- What is measured: band width relative to the instrument’s own recent history.
- What it means: recent movement has become unusually narrow compared with earlier conditions.
- What it does not mean: price direction, trade quality, or breakout confirmation.
What Is a Bollinger Band Squeeze?
A Bollinger Band Squeeze forms when the upper and lower bands of Bollinger Bands move closer together. Since the bands are built around recent price variation, narrowing bands usually mean that recent price movement has become less dispersed.
This makes the squeeze a volatility-compression condition. It can mark a period where price has been moving inside a tighter range, but it should not be treated as a directional forecast. The condition describes what has happened to recent movement, not what price must do next.
A clean explanation is: the market has become quieter relative to its own recent behavior, and that quiet period is visible through narrower bands. A cleaner interpretation depends on whether the compression is real, persistent, and measured consistently.
How a Bollinger Band Squeeze Is Measured
The squeeze is usually measured by looking at the distance between the upper and lower bands. A narrower distance means the bands have contracted. Bollinger BandWidth is commonly used to express that distance as a separate width reading.
The important point is that the threshold is relative. A low width reading on one asset, timeframe, or volatility regime may not mean the same thing on another. The cleaner question is whether band width is near the low end of its own recent range, not whether it has crossed one universal number.
Diagnostic boundary: a squeeze condition is stronger when the bands are narrow compared with recent history, price movement is confined, and the condition persists for more than a brief one-candle contraction.
How to Identify a Bollinger Band Squeeze
A Bollinger Band Squeeze is easier to identify when the visual narrowing and the measurement agree. Narrow-looking bands alone can be misleading if the contraction is brief, isolated, or not low relative to the recent BandWidth range.
| Check | What to look for | Why it matters |
|---|---|---|
| Band distance | The upper and lower bands move closer together. | This is the visible sign of compression. |
| Relative width | BandWidth moves toward the lower end of its recent range. | This reduces the risk of calling normal variation a squeeze. |
| Price behavior | Price movement becomes more confined inside the bands. | The squeeze is cleaner when price action also reflects reduced range. |
| Persistence | The contraction remains visible across several periods. | A one-period narrowing can be noise rather than a usable compression condition. |
The interpretation becomes weaker when only one of these checks is present. For example, bands may look narrow after a volatile move normalizes, but if BandWidth is not near a recent low and price is not confined, the squeeze label may be premature.
Clean, Weak, and Invalid Squeeze Readings
A useful squeeze interpretation separates compression from confirmation. Compression is the condition. Confirmation is a separate question that depends on later behavior and surrounding context.
| Reading type | Typical condition | Safer interpretation |
|---|---|---|
| Clean squeeze | Bands narrow, BandWidth is low relative to recent history, and price remains confined for several periods. | Compression is present. Direction is still unresolved. |
| Weak squeeze | Bands narrow briefly, but the width reading is not especially low or price remains choppy. | The market may be quieter, but the compression case is not strong. |
| Invalid or false-positive reading | Price briefly escapes the band, then returns inside the range without clean expansion. | The band escape alone did not resolve the squeeze. |
A common false-positive scenario is a brief move outside the band after a narrow period, followed by price moving back inside the prior range. That does not prove the squeeze “failed” in every sense, but it does show why a band escape should not be treated as confirmation by itself.
What a Bollinger Band Squeeze Does Not Tell You
A Bollinger Band Squeeze does not tell you which direction price will move. It also does not define trade quality, timing, risk, or whether a later move will continue. It only shows that the bands have compressed because recent movement has narrowed.
Context can change the interpretation, but it should stay separate from instruction. Volume, market structure, support and resistance, momentum readings, and broader volatility conditions may help explain whether compression is resolving or staying contained. They do not turn the squeeze into an automatic setup, entry, exit, or directional call.
Important limitation: low BandWidth can show unusual compression, but it does not guarantee expansion. Compression can persist, resolve briefly, or produce a false breakout before a clearer move develops.
Bollinger Band Squeeze vs Bollinger BandWidth
Bollinger Band Squeeze and Bollinger BandWidth are closely related, but they are not the same concept. The squeeze is the condition: the bands have narrowed around price. Bollinger BandWidth is the measurement: it helps quantify how narrow the bands are.
In simple terms, the squeeze answers “is compression present?” BandWidth answers “how narrow are the bands relative to recent conditions?” The two work together, but the measurement should not be confused with a directional signal.
Bollinger Band Squeeze vs Related Volatility Concepts
A Bollinger Band Squeeze is one type of a compression condition, but it should be separated from nearby volatility tools and hybrid squeeze indicators.
| Concept | Main focus | Key distinction |
|---|---|---|
| Bollinger Band Squeeze | Narrowing Bollinger Bands | Describes compression in Bollinger Bands, not direction. |
| Bollinger BandWidth | Band distance measurement | Measures width; it is often used to identify squeeze conditions. |
| Bollinger Percent B | Price location within the bands | Shows where price sits relative to the bands, not how compressed the bands are. |
| BB/KC Squeeze or TTM Squeeze | Relationship between Bollinger Bands and Keltner Channels | Uses a different squeeze framework and should not be treated as identical to a pure Bollinger Band Squeeze. |
| ATR | Average price range | Measures range differently and is not based on Bollinger Band distance. |
Common Mistakes When Reading a Bollinger Band Squeeze
The first mistake is treating the squeeze as a breakout prediction. A squeeze can show that movement has compressed, but it cannot say that price must expand immediately or in a specific direction.
The second mistake is using one fixed threshold for every market and timeframe. Band contraction is more useful when judged against the same instrument’s recent behavior, because normal volatility differs across assets and chart settings.
The third mistake is treating a brief band escape as enough evidence. A move outside the band can be part of a later expansion in movement, but it can also reverse back into the prior range. The interpretation improves only when compression, measurement, and later behavior agree.
FAQ
What is a Bollinger Band Squeeze?
A Bollinger Band Squeeze is a narrowing of Bollinger Bands around price. It usually means recent volatility or price dispersion has contracted relative to earlier conditions.
Does a Bollinger Band Squeeze predict direction?
No. A Bollinger Band Squeeze shows compression, not direction. Price can later move upward, downward, remain compressed, or briefly break out and return inside the range.
How is a Bollinger Band Squeeze measured?
It is commonly measured by the distance between the upper and lower Bollinger Bands, often through a BandWidth reading. The reading is most useful when compared with the same market’s recent history.
What causes a false Bollinger Band Squeeze reading?
A false or weak reading can happen when bands narrow only briefly, BandWidth is not especially low relative to recent history, or price briefly leaves the band and then returns inside the prior range.
Is Bollinger Band Squeeze the same as Bollinger BandWidth?
No. The squeeze is the compression condition. BandWidth is a measurement that can help identify how narrow the bands are.
Is Bollinger Band Squeeze the same as BB/KC Squeeze or TTM Squeeze?
No. BB/KC Squeeze and TTM Squeeze compare Bollinger Bands with Keltner Channels or use a different indicator framework. A pure Bollinger Band Squeeze focuses on narrowing Bollinger Bands.