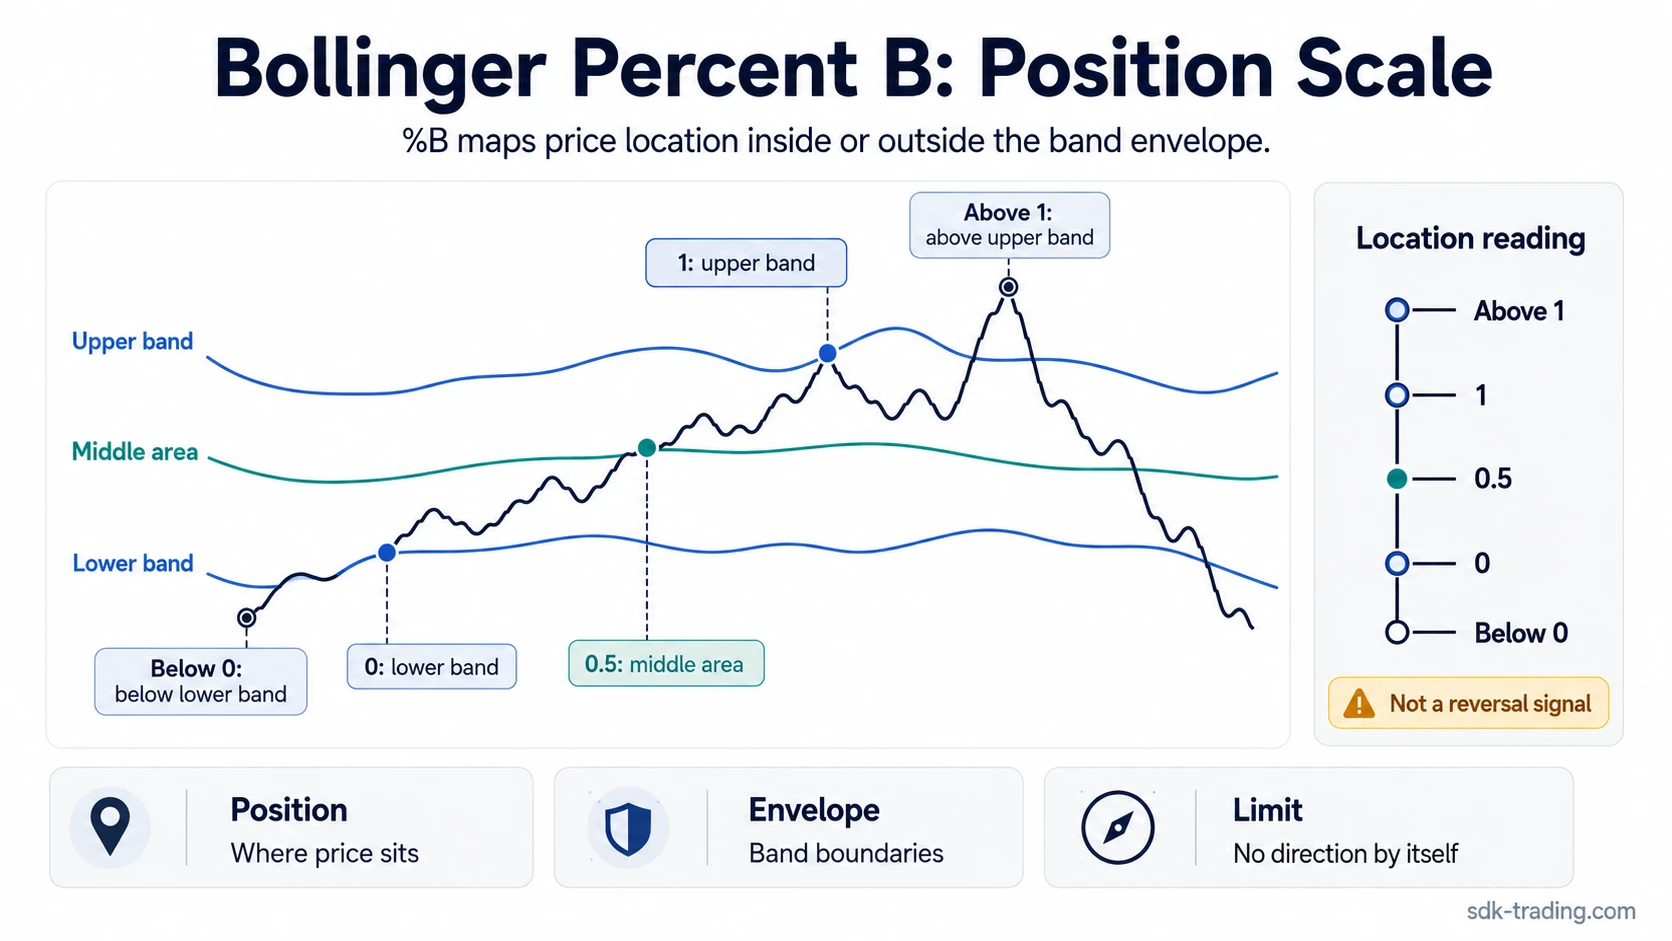
Bollinger Percent B shows where price sits inside or outside the Bollinger Bands envelope. The reading compares the current price with the lower band and upper band, so a value near 1 places price near the upper band, a value near 0 places it near the lower band, and values outside that range show price beyond the bands.
The practical boundary is that %B describes position. It does not confirm direction, reversal quality, timing, or trade quality by itself. A high reading can appear during strength, a low reading can appear during weakness, and both readings need surrounding context before they become useful.
Definition: Bollinger Percent B is a Bollinger Bands-derived indicator that measures price location relative to the upper and lower bands.
Key Points
- Bollinger Percent B measures price position inside or outside the Bollinger Bands envelope.
- A reading of 1 means price is at the upper band, 0 means price is at the lower band, and 0.5 places price near the middle of the envelope.
- Readings above 1 or below 0 show price outside the bands, but they are not automatic reversal signals.
- %B is different from Bollinger Bandwidth because %B measures location, while Bandwidth measures envelope width.
What Bollinger Percent B Measures
Bollinger Percent B measures the current price as a position inside the band envelope created by Bollinger Bands. The lower band acts as the 0 reference, the upper band acts as the 1 reference, and the space between them becomes the scale for interpreting price location.
That makes %B a position reading, not a direct volatility-width reading. If the bands expand, contract, or shift with the moving average, the same price behavior can produce a different %B reading because the envelope itself has changed.
Measurement boundary: %B can show whether price is near the upper band, near the lower band, near the middle of the envelope, or outside the bands. It cannot identify trend strength, reversal timing, or confirmation quality on its own.
Bollinger Percent B Formula
The common Bollinger Percent B formula is:
%B = (Price – Lower Band) / (Upper Band – Lower Band)
In this formula, Price is usually the selected closing price or platform-defined price input, Lower Band is the lower Bollinger Band, and Upper Band is the upper Bollinger Band. The denominator measures the current distance between the two bands, which is why changes in the band envelope affect the reading.
Many charting platforms use Bollinger Bands with a 20-period moving average and bands set two standard deviations away from that average as a common default. That default is a convention, not a universal requirement. The period length, price source, moving-average type, and standard deviation multiplier can all change the %B value.
| Input | What changes | Why it matters for %B |
|---|---|---|
| Period length | How many bars shape the moving average and bands | Shorter periods usually react faster; longer periods usually smooth the envelope. |
| Price source | Which price is measured | Close, typical price, or another input can shift the position reading. |
| Moving-average type | The centerline calculation | A different centerline can move both bands and change the location scale. |
| Standard deviation multiplier | Band distance from the moving average | Wider or narrower bands change how close price appears to the boundaries. |
How to Read Bollinger Percent B Values
The simplest way to read Bollinger Percent B is to treat the value as a location scale. Values between 0 and 1 place price inside the envelope. Values above 1 place price above the upper band. Values below 0 place price below the lower band.
| %B value | Price location | Interpretation boundary |
|---|---|---|
| < 0 | Below lower band | Outside the lower envelope; not automatic reversal proof |
| 0 | At lower band | At the lower boundary |
| 0.20 | Near lower band | Lower-side location, not a buy command |
| 0.50 | Near middle band / moving average | Mid-envelope location |
| 0.80 | Near upper band | Upper-side location, not a sell command |
| 1 | At upper band | At the upper boundary |
| > 1 | Above upper band | Outside the upper envelope; can persist in expansion |
The 0.20 and 0.80 areas are often used as lower-side and upper-side zones, but they should still be read as location zones. They do not become commands without additional evidence from price structure, volatility behavior, and confirmation.
Clean, Weak, and Invalid Bollinger Percent B Readings
A Bollinger Percent B reading becomes more useful when the position reading matches the surrounding chart context. A reading near the upper band is clearer when price acceptance, trend behavior, and volatility context support the same interpretation. It is weaker when price touches the band briefly and then immediately returns to the middle of the envelope.
| Reading type | Cleaner when | Weaker when | Invalid when |
|---|---|---|---|
| Clean reading | Price location, band behavior, and later confirmation point in the same direction. | The reading appears without price acceptance near the boundary. | The reading is treated as a complete trade signal by itself. |
| Weak reading | The value is used only as a location clue while the broader context remains unresolved. | Price touches a band briefly and returns toward the middle of the envelope. | The reading contradicts the surrounding structure and still gets forced into a conclusion. |
| Invalid reading | Not applicable as a complete interpretation. | Not applicable as a usable standalone signal. | The value is used to predict reversal timing, direction, or trade quality without confirmation. |
The cleanest use of %B is not the highest or lowest number. It is the reading where price location, band behavior, and later confirmation point in the same direction.
Why High or Low %B Can Persist
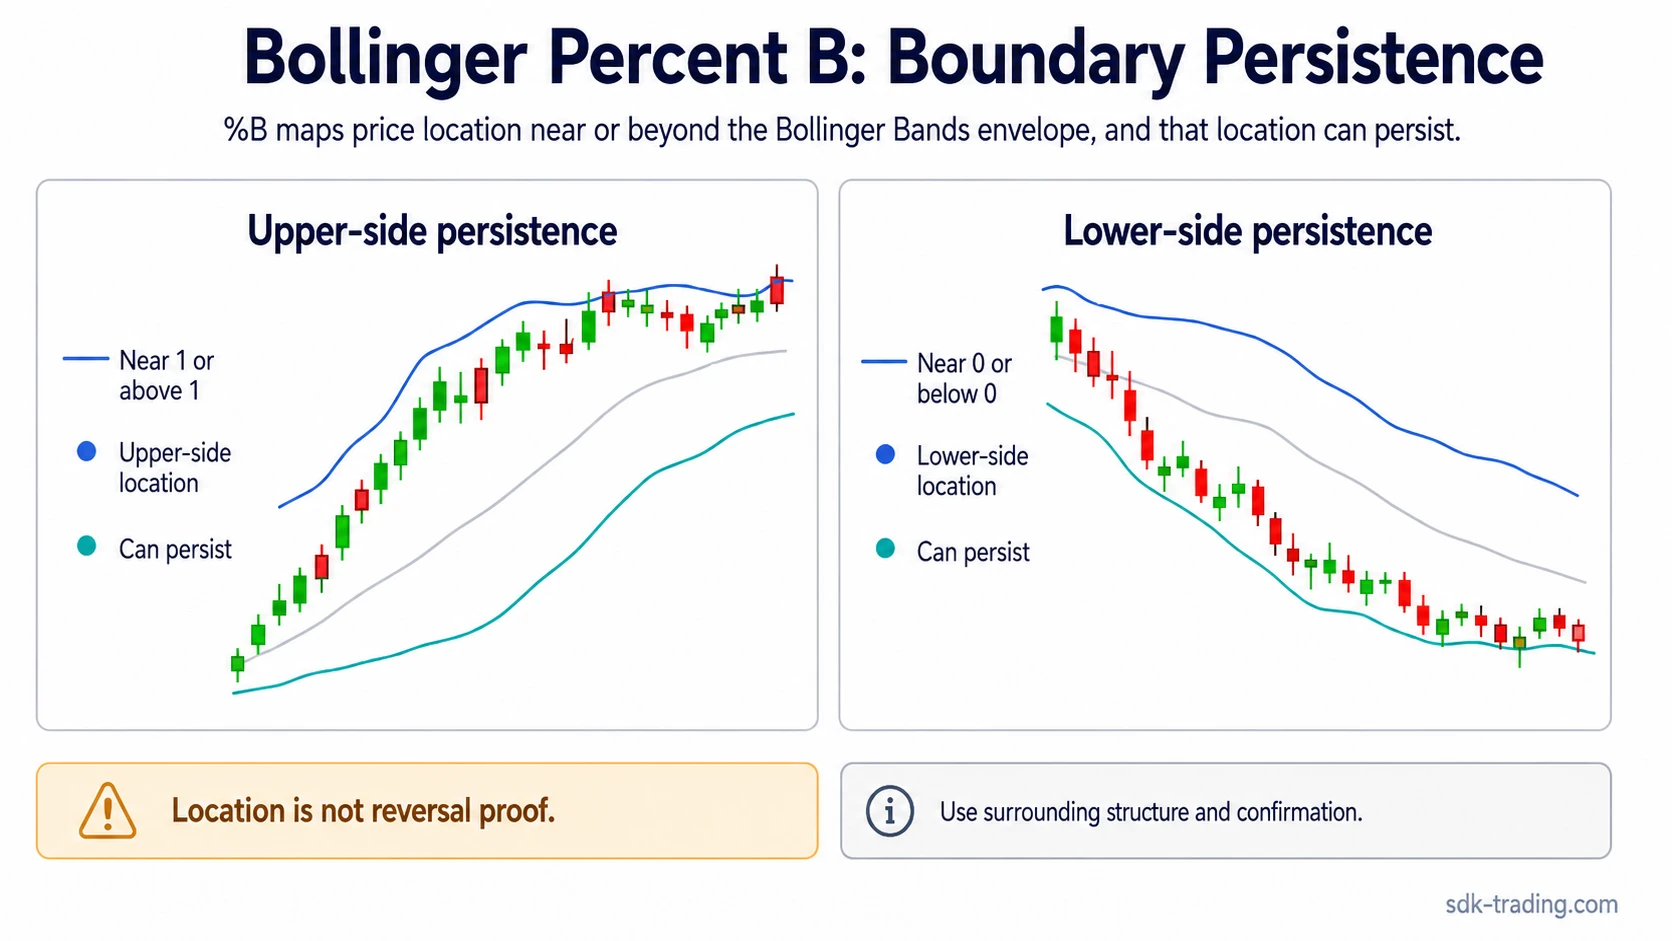
A common mistake is to assume that a high %B value means price must fall or that a low %B value means price must bounce. In strong movement, price can keep pressing near one side of the envelope while the bands expand around it. This is often described as price walking the band.
When price walks the upper band, %B can stay near 1 or above 1 for longer than expected. That condition describes upper-band location. It does not establish that price has reached a durable turning point.
Mean-reversion trap: A low %B value after a sharp standard deviation expansion can look stretched, but the reading may simply reflect strong downside location inside a wider envelope. The reversal case weakens if price cannot reclaim the envelope or hold above the lower-side area.
Bollinger Percent B vs Bollinger Bandwidth
Bollinger Percent B and Bollinger Bandwidth are related because both come from the Bollinger Bands envelope, but they answer different questions. %B asks where price is located inside or outside the envelope. Bandwidth asks how wide the envelope is.
Simple distinction: %B is about position. Bandwidth is about distance between the bands.
| Indicator | Main question | What it does not decide |
|---|---|---|
| Bollinger Percent B | Where is price relative to the bands? | It does not decide reversal timing or trade quality. |
| Bollinger Bandwidth | How wide or narrow is the band envelope? | It does not decide direction by itself. |
| Bollinger Band Squeeze | Is the envelope compressed compared with recent behavior? | It does not identify breakout direction on its own. |
Compression context can matter because a narrow envelope may change how quickly %B moves from the middle of the range toward a boundary. When that compression becomes the main question, Bollinger Band Squeeze is the more specific concept.
How %B Differs From Other Channel Readings
Bollinger Percent B belongs to the Bollinger family because it uses a moving-average envelope with standard-deviation bands. That makes it different from channel tools that define boundaries from recent highs and lows, average true range, or other range-based calculations.
Donchian Channels frame the highest high and lowest low over a lookback period. Keltner Channels commonly use an average range or ATR-style envelope around a moving average. ATR itself measures range behavior, not price location inside Bollinger Bands. These tools can all describe boundaries or volatility, but they do not measure the same thing as %B.
When Bollinger Percent B Is Most Useful
Bollinger Percent B is most useful when the question is narrow: where is price relative to the current Bollinger Bands envelope? It can help separate a middle-envelope reading from an upper-boundary or lower-boundary reading, especially when a chart visually touches or pushes beyond the bands.
The reading becomes clearer when it is combined with the state of the bands, price acceptance near the boundary, and whether later bars confirm or reject the same area. It becomes weaker when the value is treated as a standalone overbought or oversold label.
Practical boundary: %B can describe where price is. It cannot decide what price should do next without confirmation from the surrounding market structure.
FAQ
What does Bollinger Percent B show?
Bollinger Percent B shows where price is located relative to the upper and lower Bollinger Bands. Values near 1 are near the upper band, values near 0 are near the lower band, and values outside that range show price beyond the bands.
What does %B above 1 mean?
%B above 1 means price is above the upper Bollinger Band. It shows an outside-band location, but it does not prove that price must reverse.
What does %B below 0 mean?
%B below 0 means price is below the lower Bollinger Band. It shows price outside the lower envelope, but the reading still needs context before it has stronger meaning.
Is Bollinger Percent B the same as Bollinger Bandwidth?
No. Bollinger Percent B measures price location inside or outside the bands, while Bollinger Bandwidth measures how wide the bands are.
Can Bollinger Percent B predict reversals?
Bollinger Percent B does not predict reversals by itself. High or low values can persist when price keeps pressing against one side of an expanding envelope.