Keltner Channels are not simply smoother Bollinger Bands. They are range-based volatility envelopes built around a moving-average centerline, with upper and lower bands placed at an ATR-derived distance from that centerline.
The indicator helps organize how price is moving relative to a smoothed average and a changing range envelope. It can show whether the envelope is widening, narrowing, sloping, or being repeatedly tested. It does not define trade direction, entry, exit, target, stop placement, win rate, or prediction by itself.
Key Points
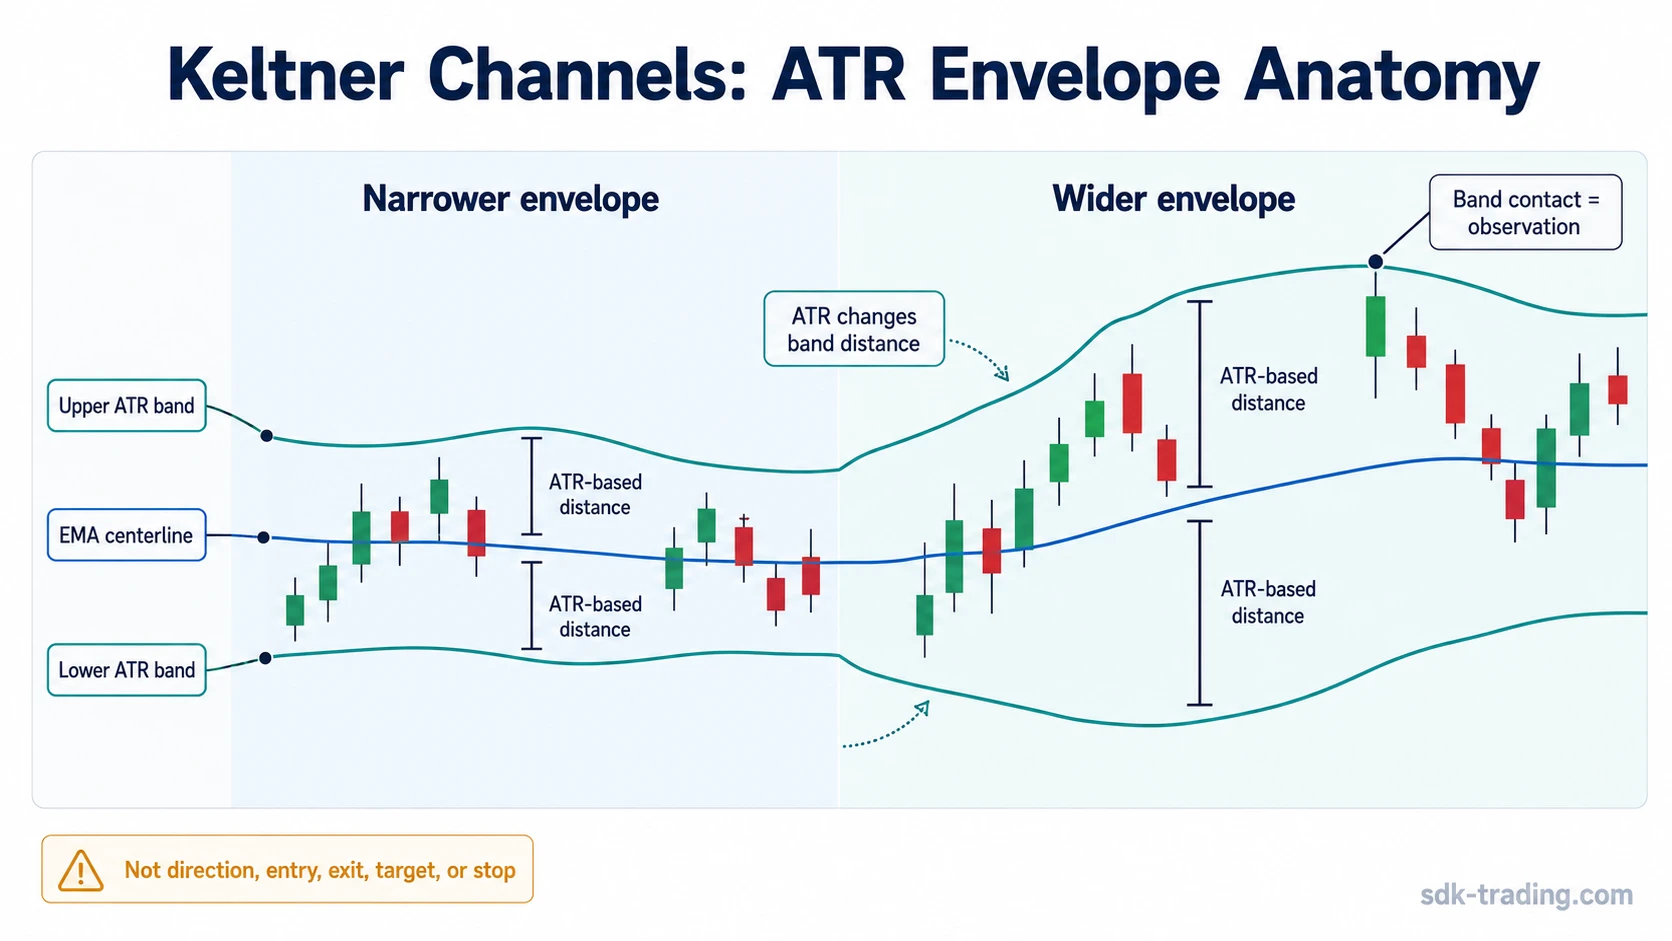
- Keltner Channels usually contain three lines: a middle EMA, an upper ATR-based band, and a lower ATR-based band.
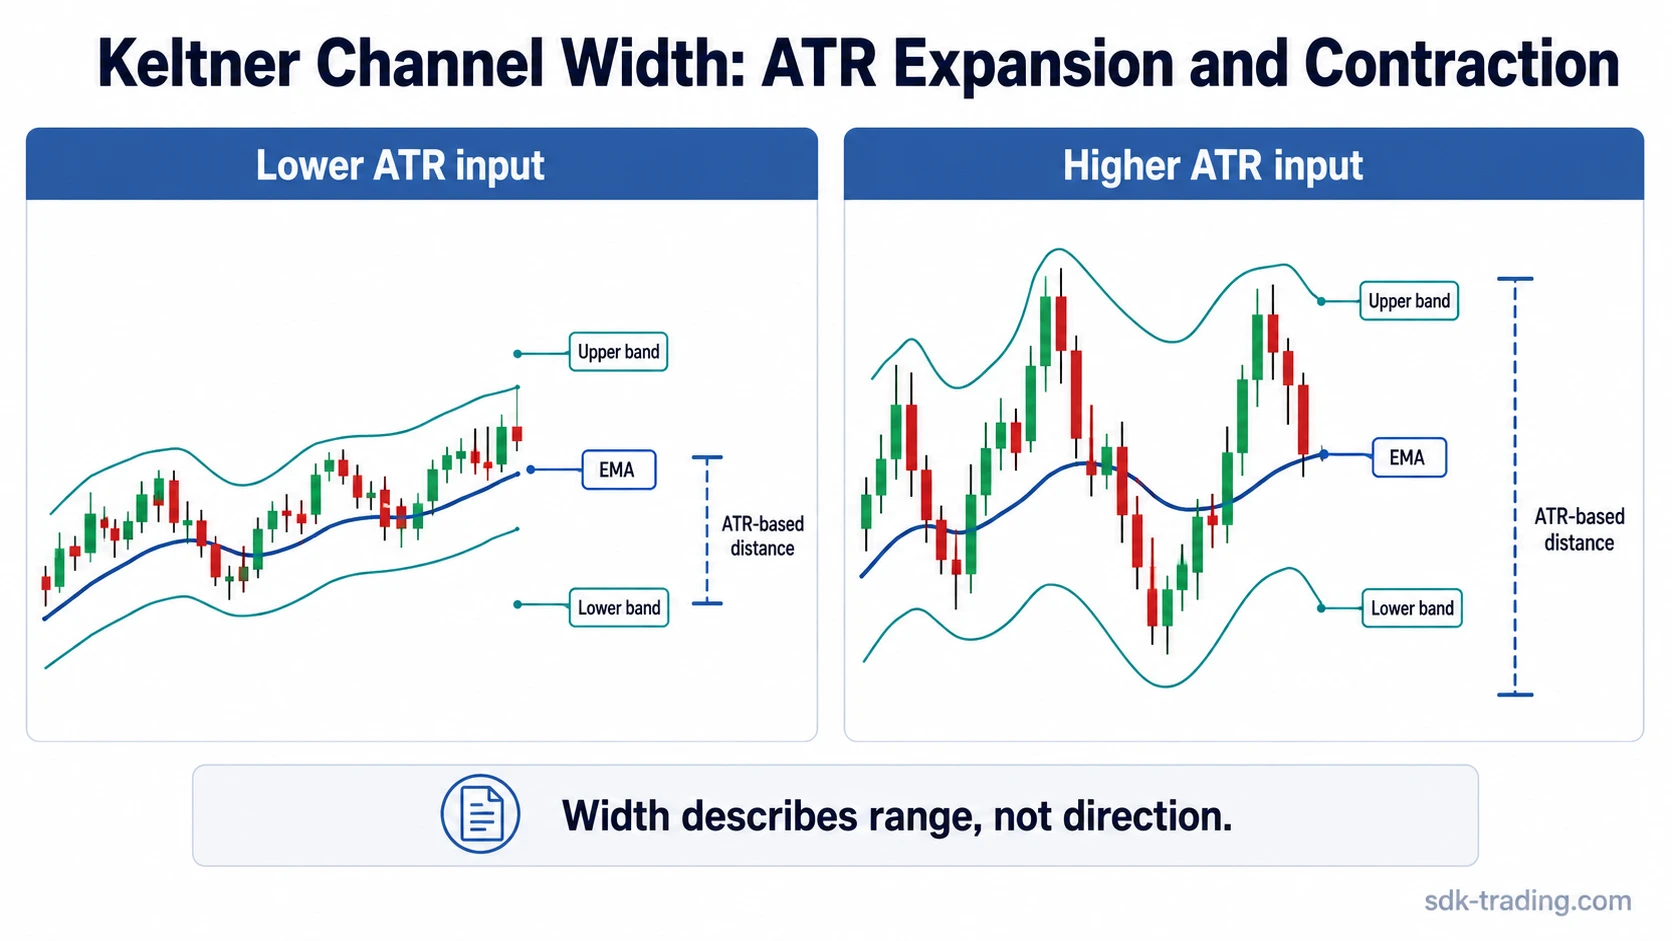
- The bands widen when ATR expands and narrow when ATR contracts.
- Channel width describes range behavior, not whether price must continue or reverse.
- A band touch is only an observation unless broader structure and follow-through support the reading.
- Keltner Channels differ from Bollinger Bands because they use ATR rather than standard deviation as the band offset.
What Are Keltner Channels?
Keltner Channels are a technical indicator that plots a volatility envelope around a moving average. The middle line is usually an exponential moving average, while the upper and lower bands are placed a selected multiple of Average True Range above and below that centerline.
Definition: Keltner Channels are ATR-based volatility bands around a moving average. They show how far price is moving from a smoothed centerline in relation to recent true range.
The useful distinction is the source of the band distance. The channel does not expand because price is far from the average in a statistical dispersion sense. It expands because the ATR input has increased, which means recent true range has become wider. When ATR contracts, the envelope becomes narrower.
How Keltner Channels Are Calculated
A common Keltner Channel structure uses three inputs: the moving-average length, the ATR period, and the ATR multiplier. Exact defaults can vary by platform, so the formula is better understood as a general envelope framework rather than one fixed setting.
General Keltner Channels Formula:
- Middle line = EMA
- Upper band = EMA + (ATR x multiplier)
- Lower band = EMA – (ATR x multiplier)
The EMA creates the smoothed centerline. ATR measures recent true range, including gaps where relevant. The multiplier controls how far the bands sit from the centerline. A larger multiplier creates a wider envelope; a smaller multiplier creates a tighter envelope.
Calculation note: Keltner Channels are historical and smoothed. The current channel reflects the selected EMA and ATR calculations, so it can lag sudden changes in price behavior.
What the Three Lines Show
The middle line shows the smoothed average around which the channel is built. When the centerline rises, it means the selected moving average is rising. When it falls, the selected moving average is falling. That slope can be useful context, but it does not establish trend quality on its own.
The upper band marks an ATR-adjusted distance above the centerline. Price trading near or beyond the upper band shows that price is pressing into the upper side of the envelope. This can reflect persistent strength, a temporary extension, or a one-bar range event depending on follow-through.
The lower band marks an ATR-adjusted distance below the centerline. Price trading near or beyond the lower band shows pressure toward the lower side of the envelope. This does not automatically mean weakness will continue or that a reversal is likely. The reading depends on structure, persistence, and how price behaves after the contact.
Why the Channel Widens or Narrows
Keltner Channels widen when the ATR component rises. This often happens after larger candles, wider intraday ranges, gaps, or a broader increase in true range. The widening shows that the recent range environment has expanded.
The channel narrows when ATR falls. This often happens when price action becomes quieter and the selected ATR period begins to absorb smaller ranges. A narrower channel shows compression in the range input, not a guaranteed future breakout direction.
Simple Keltner Channels Example: A market has a wide range move, then price action becomes quieter. The Keltner Channel may remain wide at first because ATR still reflects the earlier wide ranges. If smaller ranges persist, the bands can gradually narrow as the ATR calculation updates. This shows why the channel is smoothed and historical, not a real-time forecast of the next move.
How to Read Band Interaction Without Turning It Into a Signal
Band interaction is best treated as a measurement cue. A single touch of the upper or lower band shows that price reached the outer envelope. It is not enough by itself to define continuation, reversal, or trade quality.
The reading strengthens if price continues to interact with one side of the channel and follow-through remains visible. Repeated upper-band contact can show sustained pressure toward the upper side of the envelope. Repeated lower-band contact can show sustained pressure toward the lower side. In both cases, the surrounding price structure still controls how much weight the observation deserves.
The reading weakens if price only pokes beyond a band for one bar and quickly returns inside the envelope. A failed extension can show that the move did not sustain beyond the ATR-adjusted boundary, but it still does not confirm a reversal.
| Reading area | What it can show | What it cannot prove |
|---|---|---|
| Channel slope | Direction of the selected moving average | Trend quality by itself |
| Channel width | Range expansion or contraction | Price direction |
| Band contact | Price pressing against the envelope | Entry, exit, reversal, or continuation |
| Failed extension | Weak follow-through beyond the band | Guaranteed reversal |
What Keltner Channels Show and Do Not Show
The cleanest way to use Keltner Channels is to separate measurement from conclusion. The indicator can organize range-adjusted price behavior, but it cannot replace broader market structure.
| Question | Safer interpretation |
|---|---|
| What do Keltner Channels show? | An ATR-adjusted envelope around a moving average, including width changes, slope, and price position relative to the bands. |
| What do they not show? | They do not prove reversal, continuation, entry, exit, target, stop placement, win rate, or future price direction. |
| What strengthens the reading? | Persistent width change, repeated band interaction, follow-through, and alignment with broader price structure. |
| What weakens the reading? | One-bar pokes, sudden gaps, low-liquidity moves, immediate return inside the channel, and ATR lag after a regime shift. |
Keltner Channels vs Bollinger Bands
Keltner Channels and Bollinger Bands both form envelopes around a moving average, but they measure band distance differently. Keltner Channels use ATR, so the bands respond to true range. Bollinger Bands use standard deviation, so the bands respond to dispersion around the moving average.
This difference matters because ATR and standard deviation can respond differently to the same price sequence. A gap, a narrow consolidation after a wide range move, or a sharp dispersion event may affect the two envelopes in different ways. That does not make one automatically better. It means they answer different measurement questions.
Keltner Channels vs Donchian Channels
Keltner Channels are moving-average envelopes offset by ATR. Donchian-style channels use a rolling high and low boundary method, where the upper and lower lines come from the highest high and lowest low inside the selected lookback window.
The distinction is mechanical. Keltner Channels ask how price behaves around a smoothed average with a range-based offset. Donchian Channels ask where the recent lookback-window extremes are. A Keltner band can move because the EMA or ATR changes. A Donchian boundary changes when a new extreme appears or an old extreme leaves the window.
When Keltner Channel Readings Can Mislead
Keltner Channels can mislead when the reader treats the envelope as a decision system instead of a measurement tool. A band touch is not automatically meaningful. It may be a one-bar range expansion, a temporary extension, or a low-liquidity print that does not represent sustained pressure.
EMA and ATR smoothing also create lag. After a sudden gap or fast volatility shift, the channel can remain shaped by earlier data. That lag can make the envelope look wider or slower to adjust than current price behavior suggests.
Repeated band contact also needs care. It may show persistent pressure, but persistence still matters. If price returns inside the channel without acceptance beyond the band, the reading weakens. If range expands briefly and then contracts, the channel may stay wide for a time even though current movement has become quieter.
Important limitation: Keltner Channels can describe range-adjusted behavior, but they cannot decide whether price should continue, reverse, or remain inside the envelope. The channel is more useful as one context layer than as a standalone conclusion.
Common Questions About Keltner Channels
What do Keltner Channels measure?
Keltner Channels measure price movement around a moving-average centerline using ATR-based upper and lower bands. They show range-adjusted envelope behavior rather than a direct prediction of price direction.
Are Keltner Channels the same as Bollinger Bands?
No. Keltner Channels usually use ATR to set the band distance, while Bollinger Bands use standard deviation. Both create envelopes, but they respond to different inputs.
What is the Keltner Channels formula?
A common formula is: middle line equals EMA, upper band equals EMA plus ATR multiplied by a selected multiplier, and lower band equals EMA minus ATR multiplied by that multiplier. Exact settings vary by platform and trader preference.
Do Keltner Channels give buy or sell signals?
Keltner Channels do not provide buy or sell signals by themselves. A band touch, channel slope, or width change is only an observation until broader market structure and follow-through support the interpretation.
Why do Keltner Channels widen or narrow?
They widen when ATR rises and narrow when ATR falls. Wider channels reflect larger recent true ranges, while narrower channels reflect smaller recent true ranges.