Donchian Channels are a technical indicator used to map rolling price-extreme boundaries from the highest high and lowest low over a selected lookback period. They are not standard-deviation bands, ATR, a moving-average envelope, an oscillator, or a trade signal by themselves.
The useful reading is boundary-based. A Donchian Channel shows where the recent upper and lower price limits sit for the chosen window. It does not explain why price reached those limits, whether the next move should continue, or whether a boundary touch has enough structure behind it to matter.
Key Points
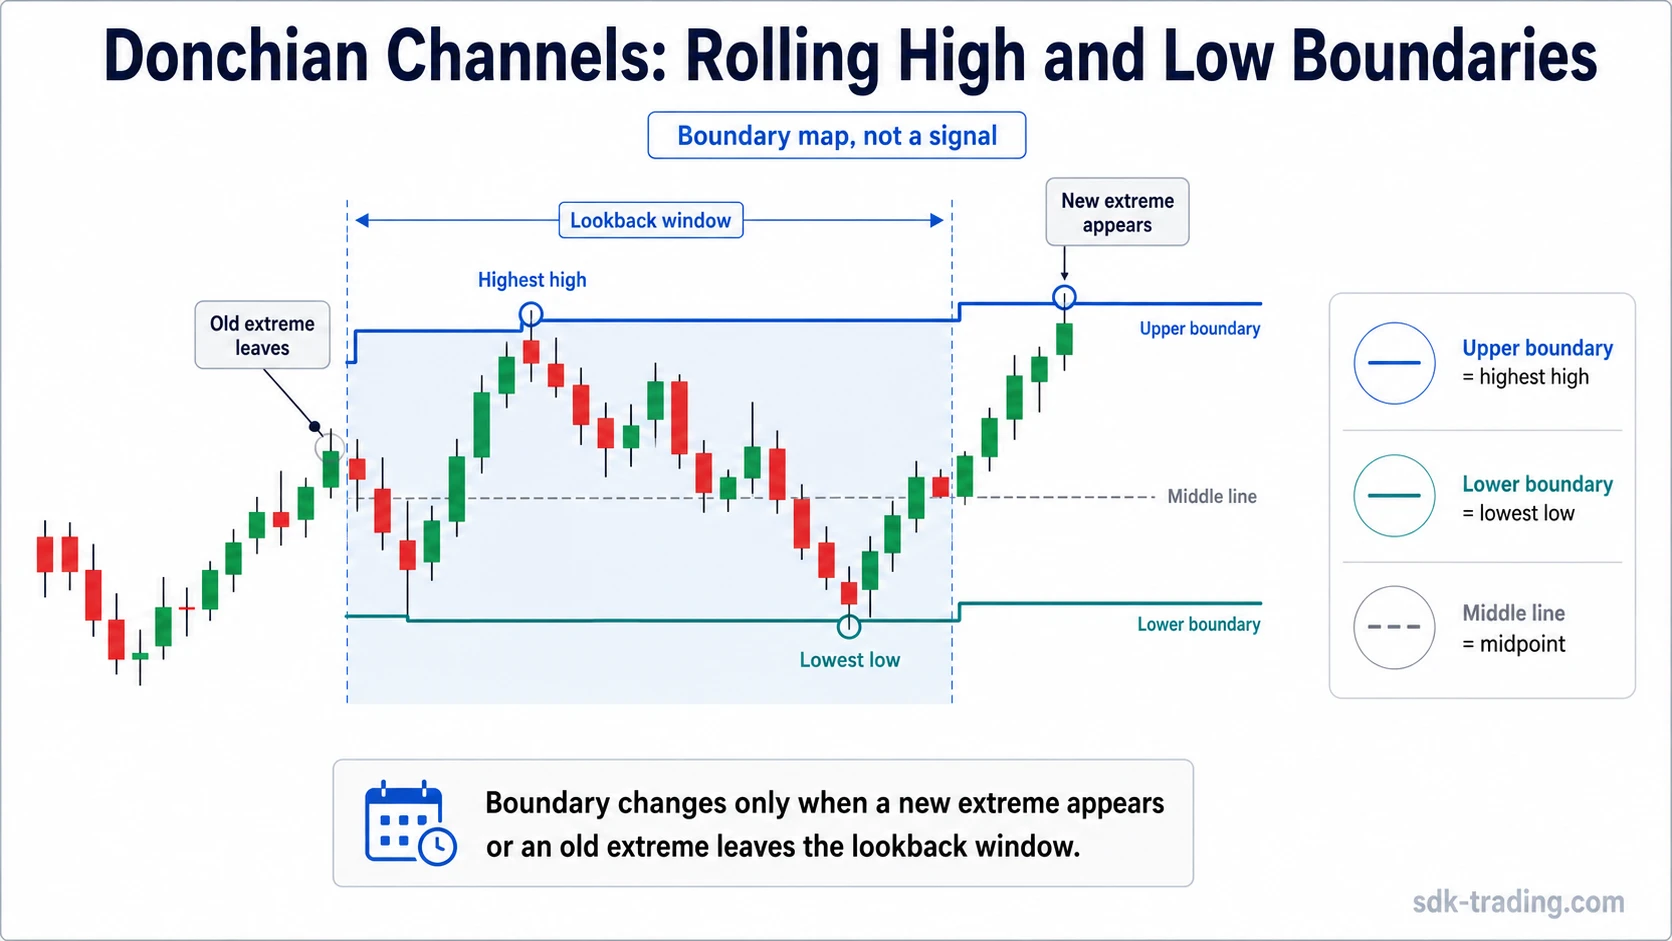
- Donchian Channels use the highest high and lowest low over a lookback period.
- The upper channel marks the rolling high boundary; the lower channel marks the rolling low boundary.
- The middle line, when used, is the midpoint between the upper and lower channel.
- Channel width shows the recent high-low range, not direction or trade quality.
- A band touch is only a boundary observation until structure and follow-through support a stronger interpretation.
What Donchian Channels Measure
Donchian Channels measure the outer price boundaries of a rolling lookback window. If the period is set to 20, the upper channel reflects the highest high recorded during the last 20 completed periods, and the lower channel reflects the lowest low recorded during the same window.
This makes the indicator different from tools that estimate dispersion around an average. Donchian Channels do not ask how far price is from a mean. They ask which price levels define the recent extreme range.
Definition: Donchian Channels are an indicator that plots an upper boundary from the highest high and a lower boundary from the lowest low over a selected number of periods. The channel updates when a new extreme appears or when an old extreme leaves the rolling window.
The channel is therefore a boundary map, not a prediction engine. It can show whether price is pressing against a recent high or low, but the channel alone does not confirm intent, acceptance, continuation, reversal, or trade quality.
What Donchian Channels Are and Are Not
| Reading | Correct Interpretation | Incorrect Shortcut |
|---|---|---|
| Upper channel | The highest high inside the selected lookback window. | A complete upward conclusion. |
| Lower channel | The lowest low inside the selected lookback window. | A complete downward conclusion. |
| Middle channel | The midpoint between upper and lower boundaries, if displayed. | A moving-average trend line. |
| Channel width | The distance between recent high and low extremes. | Proof of direction or trade quality. |
| Boundary touch | A contact with a recent extreme boundary. | A complete setup without context. |
This distinction matters because Donchian Channels can look decisive on a chart. The upper and lower bands are simple, visible, and easy to label. That clarity can also create a false shortcut: the reader may treat contact with a band as a conclusion instead of the beginning of interpretation.
Donchian Channel Formula
The Donchian Channel formula uses price extremes over a configurable lookback period. The period is usually written as N. A 20-period setting is a common reference, but it is not a universal rule and should not be treated as one.
| Line | Calculation | Meaning |
|---|---|---|
| Upper channel | Highest high over N periods | The top boundary of the recent rolling range. |
| Lower channel | Lowest low over N periods | The bottom boundary of the recent rolling range. |
| Middle channel | (Upper channel + lower channel) / 2 | The midpoint between the two boundaries, when used. |
The calculation is mechanically simple. The interpretation is not. A new high can lift the upper channel, a new low can push the lower channel down, and an old high or low can keep influencing the channel until it leaves the lookback window.
How the Lookback Window Changes the Bands
The lookback window is the main mechanism behind Donchian Channels. The bands do not move because price simply rises or falls inside the range. They move when the selected window receives a new extreme or loses an old one.
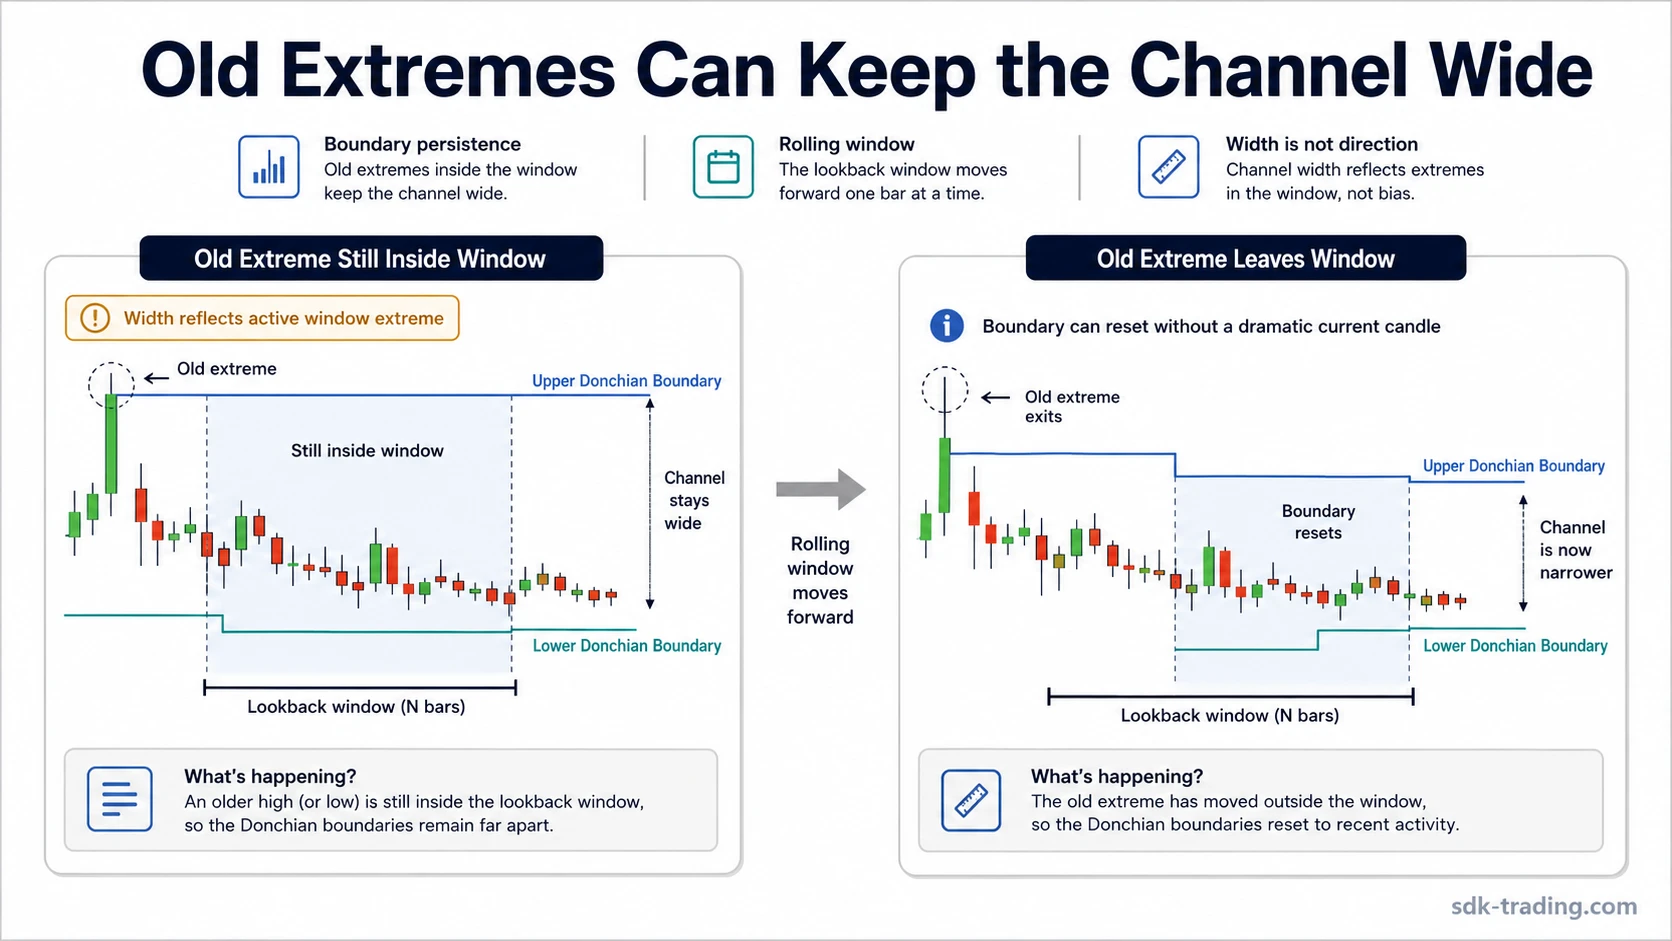
Rolling-window example: Assume a 20-period Donchian Channel. If a sharp high occurred 12 periods ago and price has been quieter since then, the upper channel may remain elevated because that old high is still inside the 20-period window. When that high leaves the window, the upper channel can drop even if the current bar did not make a dramatic move.
This is the part many simple definitions miss. The channel can remain wide after the current market has already become quieter, because the widest point may still be inside the rolling calculation. The reverse can also happen: a narrow channel can expand suddenly when one new extreme changes the range.
For this reason, Donchian Channels should be read as rolling boundary persistence. The bands show which extremes are still active in the selected window, not whether the present market is cleanly directional.
What Channel Width Can and Cannot Tell You
Channel width is the distance between the upper and lower Donchian boundaries. A wider channel means the selected lookback window contains a wider high-low range. A narrower channel means the selected window contains a tighter high-low range.
| Channel Behavior | What It Can Show | What It Does Not Prove |
|---|---|---|
| Wider channel | The recent rolling range has expanded. | That direction is reliable or that a move should continue. |
| Narrower channel | The recent rolling range is tighter. | That a breakout, reversal, or expansion is imminent. |
| Flat upper boundary | No newer high has exceeded the prior window high. | That resistance will hold. |
| Flat lower boundary | No newer low has exceeded the prior window low. | That support will hold. |
A wider Donchian Channel can appear during a strong directional move, a disorderly reversal, a volatile range, or a failed boundary push. The width describes the size of the recent price envelope. It does not classify the reason for that envelope.
Band Contact Is a Boundary Observation
When price touches the upper channel, it has reached or matched the highest high in the selected window. When price touches the lower channel, it has reached or matched the lowest low in the selected window. That is the observation. The interpretation still depends on market structure, acceptance, follow-through, and the broader context around the move.
Safe interpretation rule: A Donchian boundary touch should be treated as contact with a rolling extreme, not as a complete trading conclusion. The reading becomes more useful only when later price behavior shows whether the boundary was accepted, rejected, or ignored.
For example, an upper-channel touch after a slow drift inside a narrow range does not carry the same meaning as repeated upper-boundary pressure with stronger closes and expanding participation. The channel marks where the boundary is. It does not decide whether the pressure is durable.
Common Misreadings and Limits
The most common Donchian Channels error is treating a clean boundary line as a clean answer. The indicator can simplify the chart, but it can also hide important timing and context problems.
| Misreading | Why It Is Weak | Safer Reading |
|---|---|---|
| A wider channel means conviction. | Width may come from one old spike, not current pressure. | Check whether the current structure still supports expansion. |
| A band touch is a signal. | Contact only proves that price reached a boundary. | The reading needs structure and follow-through before it carries stronger meaning. |
| The middle line is trend proof. | It is only the midpoint of two extremes. | Use it as a reference level, not as a complete trend model. |
| A fresh boundary break is automatically meaningful. | New extremes can fail quickly without acceptance. | Separate the boundary event from the later response. |
| Backtests can use current-bar data freely. | Current-bar inclusion can create look-ahead bias if handled incorrectly. | Define whether the channel uses completed bars before testing. |
Limitation example: A market can produce one sharp high, then trade quietly for several periods while the upper Donchian boundary stays elevated. The chart may still show a wide channel, but the current market may no longer be expanding. The old extreme remains part of the calculation until it exits the lookback window.
Donchian Channels vs Bollinger Bands
Donchian Channels and Bollinger Bands can both appear as upper and lower envelopes around price, but they are built from different ideas. Donchian Channels use rolling price extremes. Bollinger Bands use standard deviation around a moving average.
| Indicator | Boundary Source | Main Reading |
|---|---|---|
| Donchian Channels | Highest high and lowest low over N periods. | Rolling price-extreme boundaries. |
| Bollinger Bands | Standard deviation around a moving average. | Dispersion around a central average. |
This difference should stay clear. Donchian Channels own the rolling-extreme concept. Bollinger Bands own the standard-deviation envelope concept. A short comparison helps prevent confusion, but the two indicators should not be collapsed into the same page intent.
Donchian Channels and Keltner Channels
Donchian Channels are also different from Keltner Channels. Donchian Channels are built from rolling highs and lows, while Keltner Channels use an average-based channel with range or volatility input. The practical distinction is that Donchian boundaries are set by observed extremes, not by a central line plus an envelope calculation.
Clean, Weak, and Invalid Donchian Readings
A cleaner Donchian reading starts with the boundary, then checks whether later behavior supports that boundary interpretation. The channel itself should not carry the full conclusion.
| Reading Quality | Condition | Interpretation Control |
|---|---|---|
| Clean | Price reaches a boundary and later behavior supports the same pressure or rejection. | The boundary reading has follow-through context. |
| Weak | Price touches a boundary once, then returns inside the range without acceptance. | The touch remains only an observation. |
| Invalid | The assumed reading depends on a stale extreme, current-bar leakage, or unsupported direction claims. | The indicator is being used beyond what it measures. |
This keeps the indicator inside its correct role. Donchian Channels can organize recent price boundaries and show when those boundaries change. They cannot confirm quality, direction, risk, or outcome without additional evidence.
FAQ
What are Donchian Channels?
Donchian Channels are an indicator that plots an upper boundary from the highest high and a lower boundary from the lowest low over a selected lookback period. They show rolling price-extreme boundaries.
How are Donchian Channels calculated?
The upper channel is the highest high over N periods, the lower channel is the lowest low over N periods, and the optional middle channel is the midpoint between the two.
What period is used for Donchian Channels?
The lookback period is configurable. A 20-period setting is a common reference, but it is not a universal rule. The selected period changes which highs and lows remain inside the rolling window.
Are Donchian Channels the same as Bollinger Bands?
No. Donchian Channels use rolling price extremes. Bollinger Bands use standard deviation around a moving average. They may look similar visually, but they measure different things.
Are Donchian Channels a trading signal?
No. A Donchian Channel touch or boundary change is not a complete signal by itself. It needs market structure, acceptance, follow-through, and risk context before it can support a stronger interpretation.