ATR vs Standard Deviation separates two different ways of reading volatility. ATR measures how wide recent price ranges are, including gap-related movement. Standard Deviation measures how far values are dispersed around a reference mean. Both can describe volatility, but they answer different questions and neither one defines bullish or bearish direction by itself.
The practical distinction is not which measure is universally better. ATR is usually cleaner when the question is about current range expansion, contraction, and the size of active movement. Standard Deviation is usually cleaner when the question is about dispersion, outliers, and how far observations have moved away from a typical value.
Key Points
- ATR is range-based and uses true range logic, so gaps and wide candles can affect the reading.
- Standard Deviation is dispersion-based and measures variation around a mean.
- The two readings can diverge when gaps, trend drift, or outliers affect range and dispersion differently.
- Higher volatility is not a direction signal, a reversal signal, or a complete trading decision.
ATR vs Standard Deviation: The Core Difference
ATR and Standard Deviation both sit inside the volatility family, but they look at movement from different angles. ATR focuses on the size of price ranges. Standard Deviation focuses on how spread out values are around an average.
| Criteria | ATR | Standard Deviation |
|---|---|---|
| Main question answered | How wide is the active trading range? | How dispersed are values around a mean? |
| Primary input behavior | Recent high, low, and previous close relationships | Distances between values and their average |
| Gap sensitivity | High, because true range accounts for gap-related movement | Depends on how the gap changes the distribution of observations |
| Trend drift sensitivity | Can stay moderate if daily ranges remain moderate | Can increase if values keep moving away from the mean |
| Outlier sensitivity | Responds to unusually large ranges | Responds strongly because squared deviations give large departures more weight |
| Best analytical use | Reading active range expansion or contraction | Reading dispersion, deviation, and distance from a reference mean |
| Main limitation | Does not explain direction or trend quality by itself | Does not explain direction or market structure by itself |
How ATR Measures Range
Average True Range starts from true range. True range considers the current high-low range and also compares the current high and low against the previous close. That matters because a market can move significantly between sessions or candles without that movement appearing only inside the current high-low bar.
After true range is calculated, ATR smooths those true range values over a selected period. The result is a volatility line that reflects average range behavior. A rising ATR means recent ranges have been expanding. A falling ATR means recent ranges have been contracting. That reading remains non-directional.
A strong upside move, a sharp downside move, a gap, or a volatile sideways session can all increase ATR if they expand true range. ATR does not know whether the movement was bullish, bearish, trend-confirming, or unstable. It only reflects the size of movement.
How Standard Deviation Measures Dispersion
The Standard Deviation indicator measures how far values are spread around a mean. In the standard calculation, deviations from the mean are squared, averaged, and then converted back into standard deviation form. This makes larger deviations matter more than small routine fluctuations.
In trading analysis, Standard Deviation is often used to understand whether observations are clustering near an average or spreading farther away from it. That can be useful when the analytical question is about dispersion, statistical distance, or how stretched a series has become compared with its recent reference point.
Standard Deviation is also connected to tools such as Bollinger Bands, where bands are placed around a moving average using standard-deviation logic. That relationship does not turn Standard Deviation into a direction signal. It only shows how dispersion can be converted into a visible volatility envelope.
When ATR Is the Better Lens
ATR is usually the cleaner lens when the immediate question is about range behavior. It is useful when price has started moving through wider candles, when gaps are part of the movement, or when the active market range is changing faster than the average price level explains.
Use ATR when the question is range-based:
- Recent candles or sessions are becoming wider.
- Gap-related movement matters to the volatility reading.
- The main concern is whether the active trading range is compressed, normal, expanding, or unstable.
- The analysis needs a practical range measure rather than a dispersion measure around a mean.
ATR becomes less useful when it is treated as a complete interpretation. A rising ATR can appear during trend continuation, failed breakout attempts, news-driven instability, or wide sideways movement. The range expansion needs structural context before it becomes meaningful.
When Standard Deviation Is the Better Lens
Standard Deviation fits better when the main question is about dispersion. It helps when price or returns are moving unusually far from a reference mean, when the analyst wants to compare current variation with recent variation, or when an outlier changes the shape of the distribution.
Use Standard Deviation when the question is dispersion-based:
- Values are spreading farther from their average.
- The distance from a reference mean matters more than the candle range itself.
- The analysis involves envelopes, bands, or deviation from a moving average.
- The main concern is whether movement is statistically stretched relative to recent observations.
Standard Deviation becomes weaker when it is used as a standalone market call. A high reading can show unusual dispersion, but it does not prove that price must reverse, continue, or stabilize. It needs trend, structure, and follow-through context.
Why the Two Readings Can Diverge
ATR and Standard Deviation can disagree because they measure different things. A market can produce wide ranges without building a clean distributional move away from the mean. A market can also drift steadily away from the mean without producing unusually wide individual ranges.
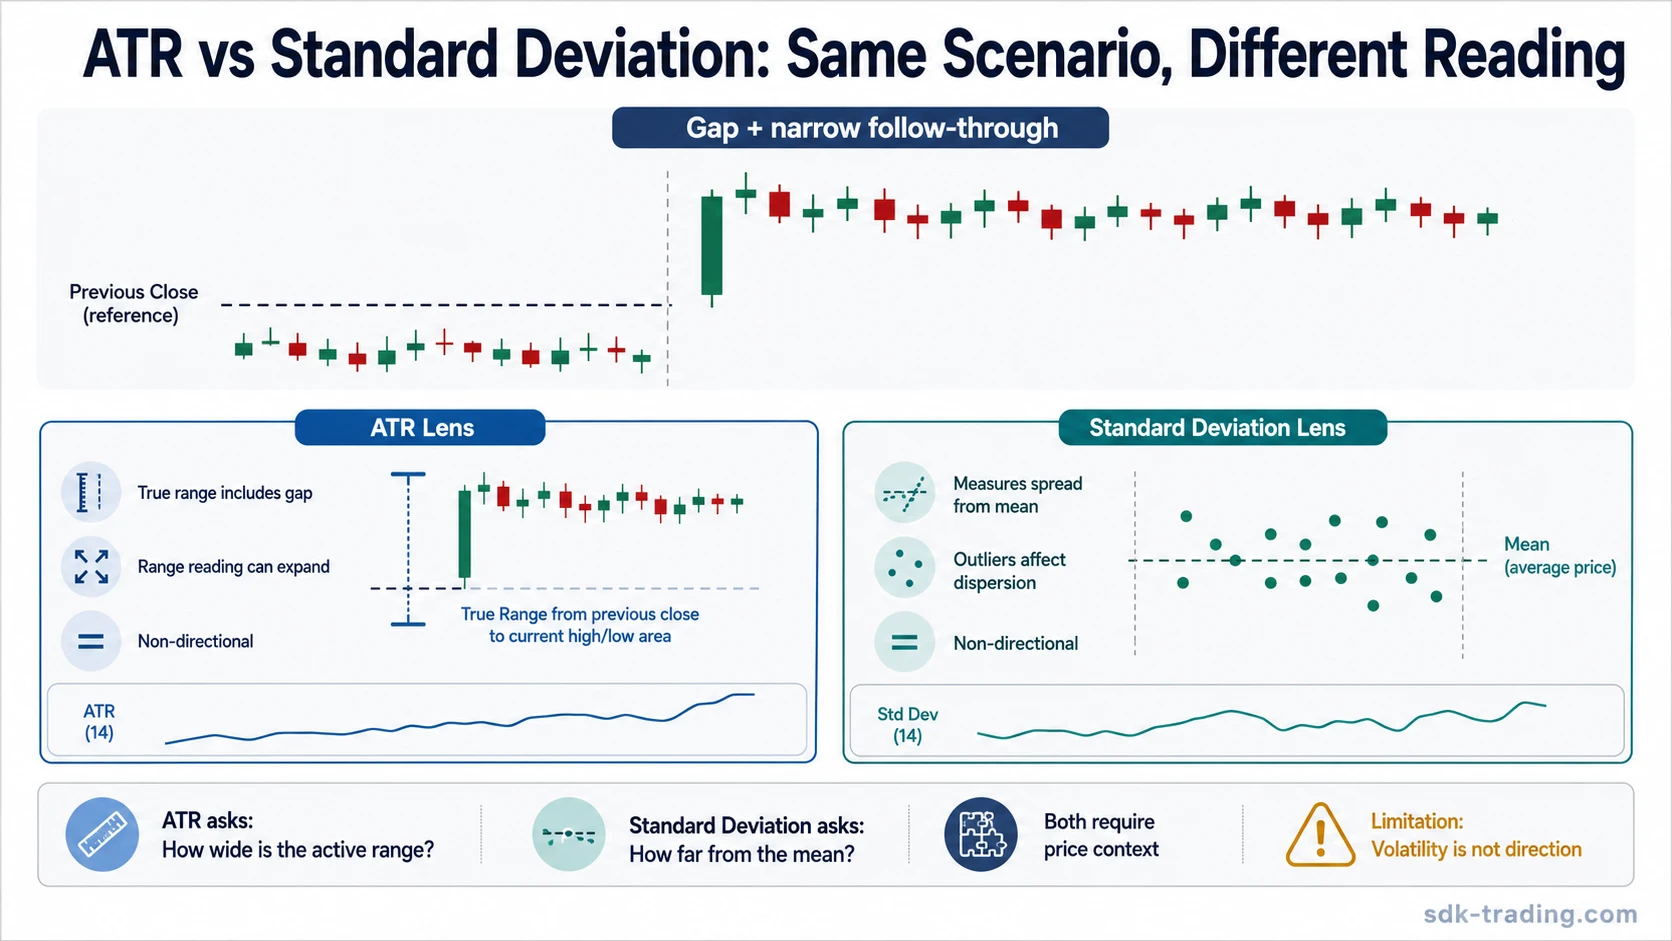
Same scenario: gap followed by narrow trading: Assume price gaps sharply higher at the open and then spends the rest of the session moving in a narrow intraday range. ATR may react because true range captures the gap-related movement from the previous close. Standard Deviation may react differently depending on how the new observations sit relative to the reference mean.
The same event can therefore look like range expansion through the ATR lens and like a distribution shift through the Standard Deviation lens. Neither reading says that the market is automatically bullish, bearish, exhausted, or likely to reverse.
A steady trend can create the opposite type of difference. If price keeps drifting higher or lower through moderate daily ranges, ATR may not expand dramatically because each individual range remains contained. Standard Deviation can still rise if observations keep moving farther from the mean.
Which Volatility Lens Fits Which Question?
| Analytical question | Cleaner lens | Reason |
|---|---|---|
| Is the active trading range expanding? | ATR | ATR is built from true range and responds directly to wider range behavior. |
| Are values moving unusually far from their mean? | Standard Deviation | Standard Deviation measures dispersion around an average. |
| Did a gap change the volatility reading? | ATR | True range includes gap-related distance from the previous close. |
| Is a band or envelope widening because dispersion increased? | Standard Deviation | Deviation-based envelopes use the distance of values from a mean. |
| Is volatility bullish or bearish? | Neither alone | Volatility measures movement, not direction. |
| Can either measure define trade invalidation? | Neither alone | Volatility can inform context, but invalidation requires separate structure, risk, and execution rules. |
Common Mistakes
Higher volatility is not a better direction signal: A rising ATR or rising Standard Deviation means volatility has changed. It does not mean direction has become clearer. Volatility can expand during continuation, reversal attempts, failed breakouts, liquidation, or unstable sideways movement.
Another mistake is treating ATR as a stop system rather than a range measure. ATR can describe recent range size, but it cannot define trade invalidation by itself. Structural invalidation and volatility are different questions.
A related mistake is treating Standard Deviation as a reversal edge. A stretched reading can show dispersion, but markets can remain stretched, compress, or continue moving depending on trend quality, liquidity, participation, and follow-through.
ATR vs Standard Deviation: What the Difference Means
ATR is the stronger tool when the question is about how much price is moving in range terms. Standard Deviation is the stronger tool when the question is about how dispersed values are around a mean. The cleanest comparison starts with the question first, then selects the volatility lens that actually measures that behavior.
Neither measure replaces market structure, trend context, confirmation, or risk definition. ATR and Standard Deviation can improve volatility awareness, but direction still has to come from price behavior and follow-through, not from the volatility reading alone.
FAQ
Is ATR better than Standard Deviation?
No. ATR is better for range-based questions, while Standard Deviation is better for dispersion-based questions. The stronger choice depends on the analytical problem.
Why can ATR and Standard Deviation disagree?
They can disagree because ATR measures true range behavior, while Standard Deviation measures dispersion around a mean. A gap, steady trend, or outlier can affect each measure differently.
Does Standard Deviation predict market direction?
No. Standard Deviation measures dispersion. It does not prove that price will reverse, continue, or hold a trend.
Can ATR predict bullish or bearish movement?
No. ATR measures range expansion or contraction. It does not identify bullish or bearish direction without separate price-structure context.