The standard deviation indicator measures how widely selected price observations are spread around a rolling average. A higher reading shows wider dispersion inside the lookback window; a lower reading shows tighter clustering. The reading describes volatility state, not whether price should rise, fall, reverse, continue, or be traded.
Definition: In trading, the standard deviation indicator is a volatility and dispersion tool. It compares selected price values with their average over a chosen lookback period, then expresses how far those values typically sit from that average.
Key Points
- Standard deviation measures dispersion around a rolling average, not trend direction.
- High readings show wider price spread inside the selected window.
- Low readings show tighter clustering or relative compression.
- Outliers, lookback length, and price scale can distort interpretation.
What Is the Standard Deviation Indicator?
The standard deviation indicator is a trading indicator that shows how far selected prices are distributed from their average over a chosen period. It is usually treated as a volatility measure because wider dispersion means price has been moving farther from its recent average, while tighter dispersion means price has been staying closer to it.
The indicator does not classify movement as bullish or bearish. A market can produce a high standard deviation reading during a sharp advance, a sharp decline, or a disorderly two-sided range. The calculation only sees distance from the average. It does not know whether the move is constructive, exhausted, supported by structure, or usable as a trade idea.
Interpretation boundary: Standard deviation can show that price behavior has become more spread out or more compressed. It cannot confirm trend quality, future direction, entry timing, exit placement, or trade validity by itself.
What the Indicator Measures
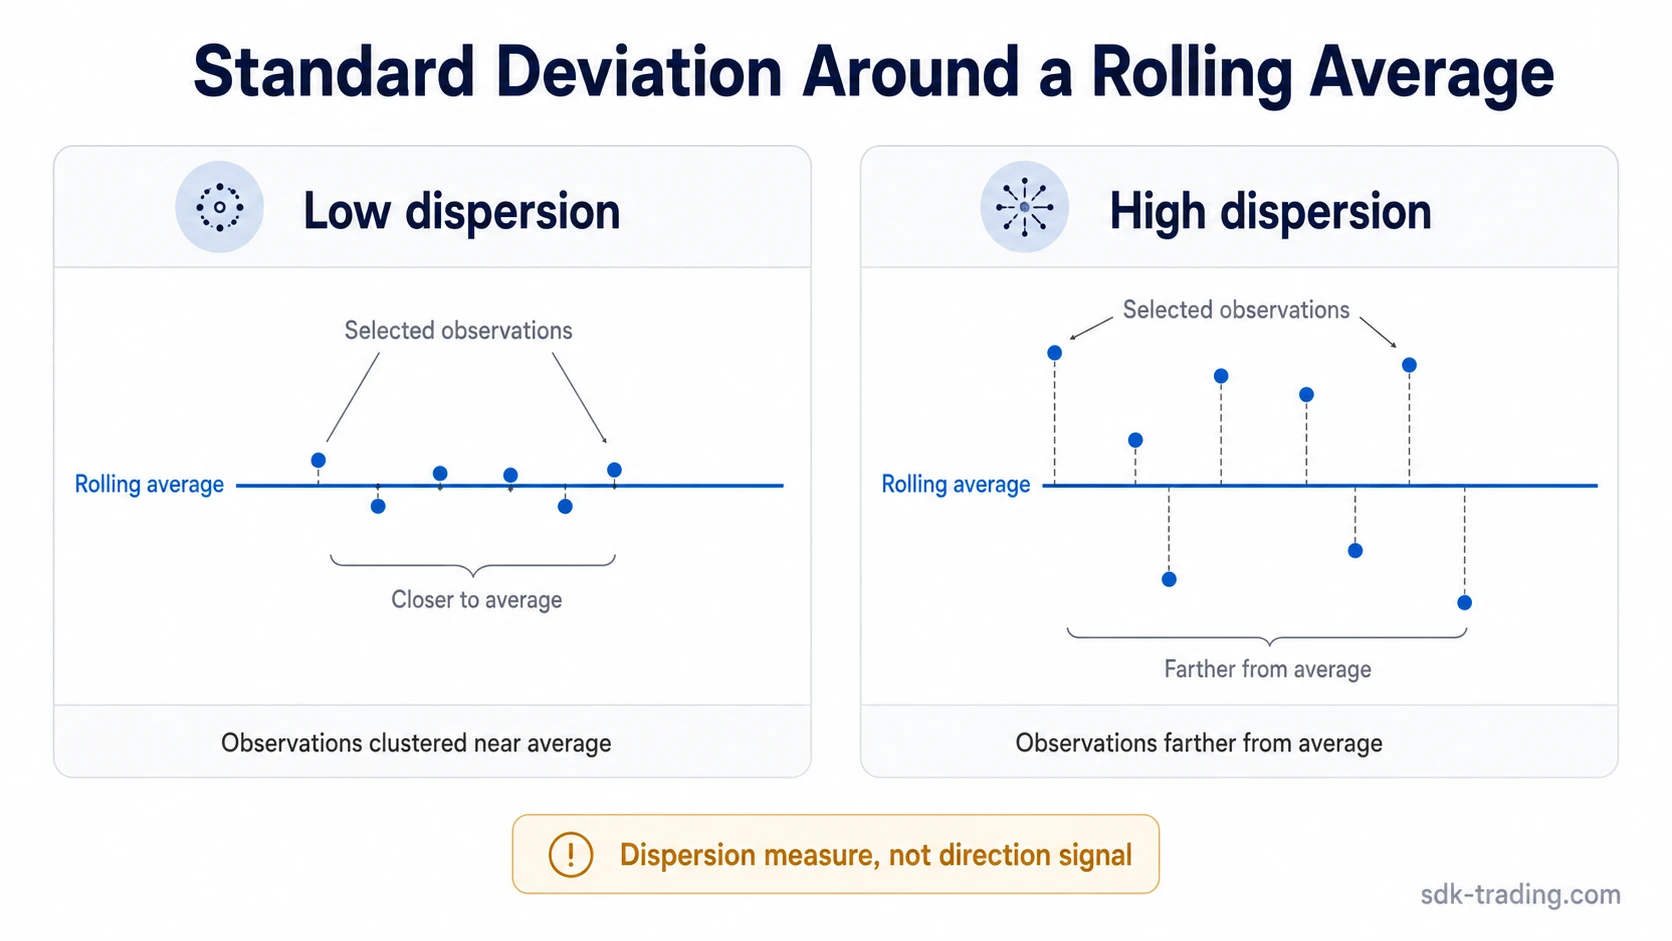
The indicator measures the dispersion of selected price observations around a rolling average. If the selected prices are close to the average, the standard deviation reading stays relatively low. If the selected prices are widely scattered above and below the average, the reading rises.
Both upside and downside movement can increase the reading. A strong upward push can widen dispersion because recent prices are far above the average. A strong downward push can do the same because recent prices are far below the average. A choppy range can also create a higher reading if the swings are wide enough.
This makes standard deviation useful as a state descriptor. The same elevated reading can come from a persistent move away from the average, a wide two-sided range, or one unusually large observation. The reading becomes more useful after the source of the dispersion is separated from any directional interpretation.
How the Calculation Works
The calculation is often presented as a statistics formula, but the trading logic is simple: compare recent price values with their average, measure how far they are from that average, and convert that distance into one volatility reading.
- Select the price observations. Most charting tools use closing prices by default, but the selected input can vary by platform or user setting.
- Calculate the rolling average. The average is the mean of the selected prices inside the lookback window.
- Measure each deviation from the mean. Each price is compared with the average to see how far it sits from that reference point.
- Square the deviations. Squaring keeps positive and negative deviations from canceling each other out.
- Calculate variance. The squared deviations are averaged.
- Take the square root. The square root converts the variance back into a price-distance style reading.
- Update as the window rolls. When a new price enters the lookback window and an older price leaves, the reading changes.
Calculation caveat: The indicator is historical. It is built from values already inside the selected window. It can describe recent dispersion, but it does not know what the next price bar will do.
How to Read High and Low Values
A high standard deviation reading means the selected prices are widely spread around their average. This usually reflects a higher-volatility state inside the lookback window. It may appear during expansion, disorderly movement, sharp repricing, or a sequence of wide closes away from the mean.
A low standard deviation reading means the selected prices are clustered more tightly around their average. This usually reflects a lower-volatility state, relative compression, or a quieter window. It does not guarantee that expansion will follow, and it does not identify the direction of any later move.
| Reading | What it shows | What it does not show |
|---|---|---|
| High standard deviation | Prices are widely dispersed around the rolling average | Bullish direction, bearish direction, trend quality, or trade validity |
| Low standard deviation | Prices are tightly clustered around the rolling average | A guaranteed breakout, reversal, continuation, or future expansion |
| Rising standard deviation | Dispersion is increasing inside the selected window | Whether the move should be followed, faded, or traded |
| Falling standard deviation | Dispersion is decreasing inside the selected window | Whether the market is safe, stable, or ready for a new move |
Diagnostic Boundary: What Can Weaken the Reading?
The most useful way to read standard deviation is as a diagnostic boundary. It answers a narrow question: how spread out are the selected prices around their rolling average? It should not be stretched into a complete market view.
| Diagnostic question | Standard deviation indicator answer |
|---|---|
| What does it measure? | Dispersion of selected prices around a rolling average |
| What does it not measure? | Direction, trend quality, entry, exit, target, stop, or trade validity |
| What strengthens the reading? | Widening or compression that persists across the selected window |
| What weakens the reading? | One outlier, poor parameter choice, price-scale comparison, or directional misuse |
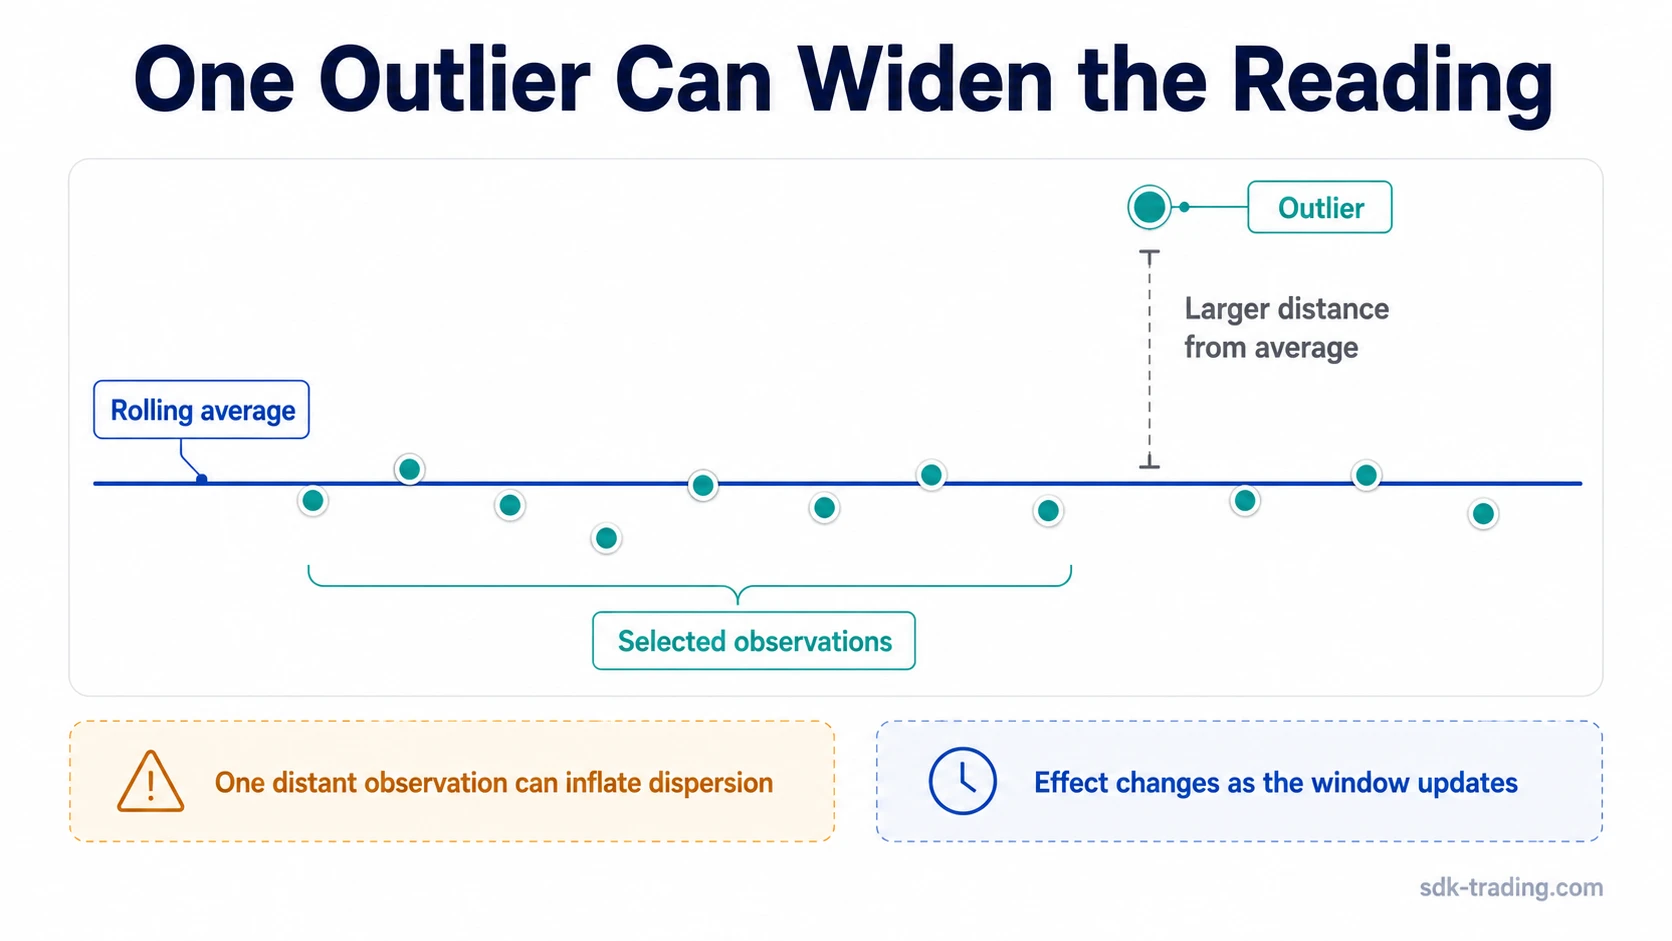
A reading becomes more useful when it matches visible price behavior across the window. For example, a rising reading is more coherent when several observations are increasingly far from the average, not when the entire change comes from one unusual bar.
Parameter and Lookback Sensitivity
The lookback period controls which observations are included. A short lookback can react quickly to new price movement, but it can also become noisy. A longer lookback usually smooths the reading, but it may respond more slowly when market behavior changes.
The selected price input also matters. A calculation based on closing prices can behave differently from one based on another selected price field or transformed input. The indicator should be interpreted according to the data it actually measures, not according to a generic volatility label.
Parameter note: There is no universal best setting. The same setting can behave differently across markets, timeframes, and volatility regimes. The useful question is whether the chosen window matches the behavior being evaluated.
A Practical Dispersion Scenario
Consider two rolling windows. In the first window, most closes sit close to the average. The standard deviation reading remains low because the observations are clustered. In the second window, closes begin appearing farther above and below the average. The reading rises because the price observations are now more widely dispersed.
That wider reading confirms dispersion, not direction. It does not say whether the market is beginning a durable trend, forming a reversal, or entering an unstable range. It only says that the selected price observations are farther from their average than they were before.
Outlier caveat: One unusually large price move can temporarily inflate standard deviation. If the wider reading is mostly caused by a single outlier, it may overstate the persistence of the volatility change.
Where Standard Deviation Fits Among Volatility Indicators
Standard deviation belongs inside the volatility and dispersion family of indicators. It is especially important in tools that build bands around a moving average, because the band distance can expand or contract as dispersion changes.
This is different from ATR-envelope logic. Standard-deviation-based bands respond to dispersion around a moving average, while Keltner Channels use ATR-based distance from an EMA. That distinction matters because dispersion around a mean and true range behavior are related volatility ideas, but they are not the same measurement.
Bollinger-style bands, BandWidth, and %B are related because they use or interpret standard-deviation-based band behavior. The important boundary here is narrower: standard deviation measures dispersion around an average, while those tools apply that measurement inside band or position frameworks.
Limitations and Common Misreadings
The most common misreading is treating high standard deviation as a directional signal. A high reading can occur during an advance, a decline, or a wide range. The first question is not whether the reading is bullish or bearish, but what produced the wider dispersion inside the selected window.
Another limitation is price-scale comparison. A raw standard deviation value from a high-priced market cannot always be compared directly with a raw value from a lower-priced market. The number is tied to the scale of the price input, so cross-market comparison can be misleading unless the values are normalized or interpreted within their own context.
Normal-distribution language also needs care. Standard deviation is often associated with statistical distribution, but market prices do not always behave like stable normal distributions. Gaps, volatility clustering, regime shifts, and outliers can make a clean statistical reading less stable than it appears.
| Common misreading | Safer reading |
|---|---|
| High standard deviation is bullish | High standard deviation means wider dispersion, not bullish direction |
| Low standard deviation predicts a breakout | Low standard deviation shows compression, not a guaranteed expansion |
| One spike confirms a volatility regime shift | One outlier can distort the reading until the rolling window updates |
| Raw values are comparable across all assets | Price scale and input selection affect the raw reading |
FAQ
What does the standard deviation indicator show in trading?
It shows how widely selected price observations are dispersed around a rolling average. A higher value means wider dispersion, while a lower value means tighter clustering.
Is a high standard deviation bullish or bearish?
Neither. A high reading is direction-neutral. It can appear during rising markets, falling markets, or wide two-sided movement.
How is standard deviation different from ATR?
Standard deviation measures dispersion around an average. ATR measures true range behavior, including gaps and range expansion. Both relate to volatility, but they answer different measurement questions.
Why can one large price move distort standard deviation?
A large outlier can sit far from the average and increase the calculated dispersion. The effect can remain until the rolling window updates and that observation becomes less influential or leaves the window.