Average True Range (ATR) is a range-based trading volatility indicator that measures how much price movement expands or contracts through true range. ATR tracks volatility, not bullish or bearish direction, so a rising ATR means movement is widening, not that price has confirmed a trend.
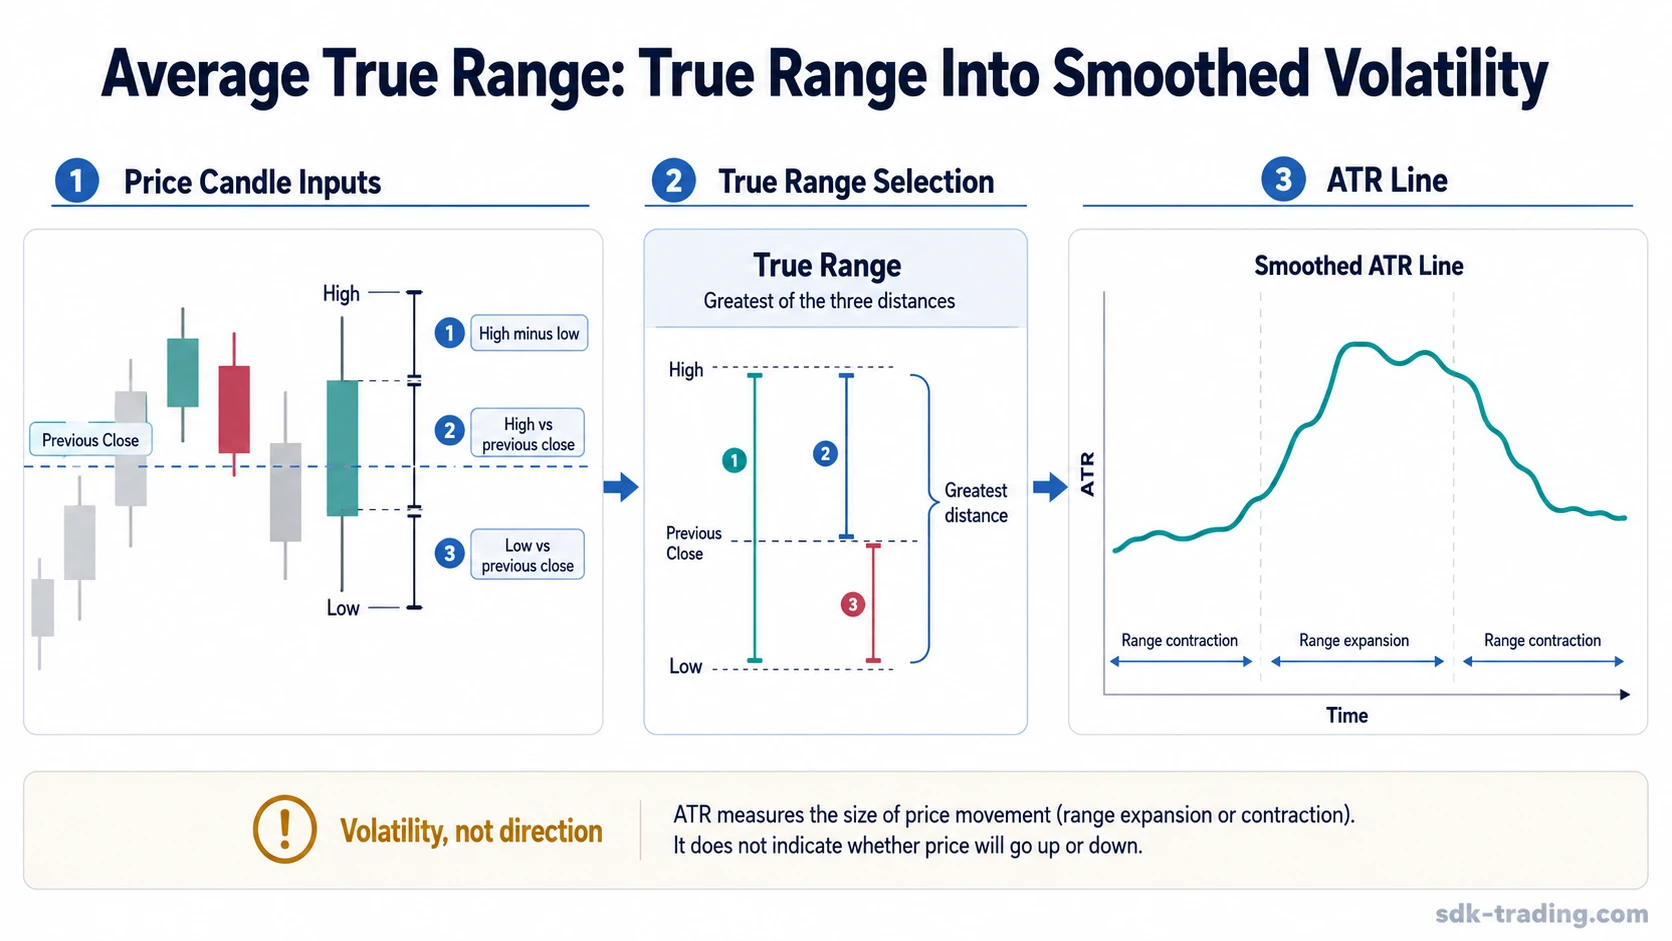
Definition: Average True Range (ATR) is a smoothed average of true range values. True range compares the current high-low range with the distance from the previous close, which allows ATR to capture gap-inclusive volatility instead of only the visible candle range.
ATR is useful when the main question is whether a market has shifted from quiet ranges into wider movement, or from wider movement back into compression. It does not identify who controls the move. Direction has to come from price structure, trend context, or another separate form of analysis.
Key Points
- Average True Range measures volatility through true range, not price direction.
- ATR rises when ranges widen, gaps increase, or the smoothed true range expands.
- ATR falls when movement contracts and recent true range values become smaller.
- Shorter ATR periods react faster, while longer periods smooth the line and respond more slowly.
- ATR can be used in risk and trailing-stop frameworks, but the indicator itself only measures volatility.
What Average True Range (ATR) Measures
ATR measures the size of recent price movement. A higher ATR reading means the market has been moving through wider ranges. A lower ATR reading means recent movement has been narrower. The reading is usually expressed in price units, not as a directional opinion.
The useful boundary is simple: ATR describes how much movement is occurring, not which side is winning. A market can rise with increasing ATR, fall with increasing ATR, or move sideways with occasional volatility spikes. The line only says that range behavior has changed.
Boundary: ATR can indicate range expansion or contraction. It does not prove trend strength, reversal quality, buyer control, seller control, or trade confirmation by itself.
How True Range Creates the ATR Line
ATR starts with true range. True range is designed to include normal candle range and gaps from the previous close, so it can reflect volatility that a simple high-low measurement would miss.
For each candle, true range is the greatest of three values:
| True range input | What it captures |
|---|---|
| Current high minus current low | The full range of the current candle. |
| Absolute value of current high minus previous close | An upward gap or move away from the prior close. |
| Absolute value of current low minus previous close | A downward gap or move away from the prior close. |
ATR then smooths those true range values over a selected period. Many charting platforms use 14 periods as a common default, but the exact smoothing method can vary by platform, so the interpretation should focus on how range behavior changes rather than on a single universal calculation setting.
What ATR Shows and Does Not Show
ATR shows whether recent price movement has become wider or narrower. That makes it a volatility tool, not a trend tool. A rising ATR during an advance can mean the advance is moving through wider ranges. A rising ATR during a decline can mean the decline is also moving through wider ranges.
| ATR reading | Reasonable interpretation | Boundary |
|---|---|---|
| ATR expands | Recent ranges or gap-inclusive movement are increasing. | Expansion does not identify bullish or bearish direction. |
| ATR contracts | Recent ranges are becoming narrower or smoother. | Contraction does not guarantee that a breakout will follow. |
| ATR spikes once | One candle or gap may have sharply increased true range. | A single spike can fade if later ranges return to normal. |
| ATR stays elevated | Wide movement may be persisting across multiple periods. | Direction still needs separate price evidence. |
ATR becomes more useful when it is read beside the actual candles that created it. A line rising from several wider ranges is different from a line lifted by one unusual gap. The first condition suggests a broader volatility shift. The second may be a temporary disturbance unless later candles continue to show wider movement.
Clean, Weak, and Invalid ATR Readings
A stronger ATR interpretation separates volatility behavior from direction claims. The clean reading identifies a change in range behavior. The weak reading notices that the indicator may be reacting to a limited or isolated event. The invalid reading turns ATR into evidence it does not provide.
| Reading quality | What it looks like | Safer interpretation |
|---|---|---|
| Clean ATR reading | ATR expands while multiple candles show wider ranges, larger gaps, or a visible calm-to-volatile transition. | Volatility has changed, and the chart can be checked for whether price structure supports a directional reading. |
| Weak ATR reading | ATR rises because of one isolated spike, or the selected period is too short for the intended market view. | The line may be reacting to a temporary shock rather than a persistent volatility regime. |
| Invalid ATR reading | ATR is treated as proof of direction, confirmation, or a trade trigger. | The indicator has been overextended beyond what range-based volatility can show. |
Example of a Basic ATR Reading: Price moves through several narrow daily ranges, then opens with a gap and begins printing wider candles. ATR rises because true range values increase. The reading supports a volatility-expansion observation. If later ranges contract again, the spike is less useful as evidence of a lasting volatility shift; if wider ranges persist, the volatility shift becomes easier to defend. Direction still has to come from separate price structure.
Why ATR Period Settings Change the Reading
ATR period settings control how quickly the line reacts to new true range values. A shorter period gives more weight to recent movement, so the line can turn faster after a gap or sudden range expansion. A longer period smooths more data, so the line changes more slowly and filters out some short-lived movement.
| ATR setting choice | Typical effect | Main limitation |
|---|---|---|
| Shorter lookback | More responsive to recent range changes. | More sensitive to one-off spikes and noisy movement. |
| Longer lookback | Smoother view of range behavior. | Slower to reflect a fresh volatility shift. |
| Default platform setting | Useful as a consistent baseline. | Not automatically suited to every market, timeframe, or use case. |
No ATR period is universally best. The setting should match the observation being made. Short-term range changes and longer-term volatility background are different questions, so the same ATR number can be too sensitive for one use and too slow for another.
ATR and Nearby Volatility Concepts
ATR belongs to the volatility indicator family, but it measures volatility differently from band-based tools. ATR focuses on range and gap-inclusive movement. Bollinger Bands use a moving average and band structure around price, so their reading is tied to envelope behavior rather than true range alone.
A volatility contraction can also be studied through a Bollinger Band Squeeze, where the focus is band narrowing and later expansion. ATR can show that ranges are changing, but it does not describe whether price is pressing against an upper or lower band.
ATR can also appear in workflows that discuss position risk or trailing logic, but those are separate applications. ATR in risk management deals with how volatility context can affect risk decisions. An ATR trailing stop uses ATR as part of a trailing method rather than as the definition of the indicator itself.
Common ATR Mistakes
A common mistake is reading rising ATR as bullish or bearish evidence. The line only shows that movement has widened. Direction still depends on the chart behavior around that movement, including whether price accepts or rejects the area being tested.
Another mistake is treating one ATR spike as a lasting volatility shift. A single gap or unusually wide candle can lift the line temporarily. The interpretation becomes more stable only when later true range values remain elevated or when the broader chart continues to show wider movement.
ATR can also become misleading when the period setting does not match the intended observation. A short setting may overreact to noise. A long setting may hide a new volatility transition until several periods have passed. The setting changes the sensitivity of the reading, so the number should not be treated as context-free.
FAQ
What does Average True Range (ATR) mean in trading?
Average True Range (ATR) means the smoothed average of recent true range values. In trading, it is used to read volatility expansion or contraction, not price direction.
Does ATR show bullish or bearish direction?
No. ATR measures the size of recent movement. A rising ATR can appear during an advance, a decline, or unstable sideways movement, so direction needs separate price evidence.
How is ATR calculated?
ATR starts with true range, which selects the greatest value from the current high-low range, the current high versus previous close, or the current low versus previous close. Those values are then smoothed over a selected period.
Why can ATR rise after a gap?
ATR can rise after a gap because true range includes the distance from the previous close. That allows the indicator to capture volatility that a simple current high-low range could miss.