A Bollinger Bands strategy is a conditional framework for reading how price behaves around a volatility envelope. It is not a mechanical entry-and-exit system. The useful work is to classify the volatility state, read the type of band interaction, check whether compression or expansion is developing, and define what would make the interpretation weak.
Bollinger Bands create the envelope structure: a middle moving average with upper and lower bands based on standard deviation. Strategy work begins only after that structure is placed inside a sequence. A price touch at the upper or lower band is only one observation. The same touch can occur during an exhaustion move, a strong trend, a choppy range, or a temporary volatility burst.
The safer reading is sequential. First classify whether the bands are compressed, normal, expanding, or unstable. Then separate an isolated band touch from repeated outer-band contact. After that, check whether the move has structure, follow-through, or failure. Without that sequence, Bollinger Bands can easily be reduced to a misleading upper-band and lower-band rule.
Key Points
- Bollinger Bands strategy works best as a volatility-envelope reading process, not as a fixed trade rule.
- An isolated outer-band touch is only the first observation; later structure determines whether it was accepted, rejected, or simply noise.
- Repeated outer-band contact can show sustained pressure when structure and follow-through support that reading.
- Compression, expansion, BandWidth, %B, and ATR describe different parts of the same environment.
- The main risk is over-reading a band event before price behavior confirms whether the move is accepted or rejected.
What a Bollinger Bands Strategy Should Actually Define
The strategy should define a process for interpreting envelope behavior. It should answer six questions before the band event becomes useful: What is the volatility condition? Where is price relative to the bands? Is the band contact isolated or repeated? Is compression turning into expansion? Does range behavior support the reading? What condition would weaken the interpretation?
Working definition: a Bollinger Bands strategy is a structured way to evaluate price behavior around standard-deviation bands, using band contact, compression, expansion, and supporting volatility measures to form a conditional market reading.
This keeps the indicator in its proper role. The bands frame dispersion and boundary behavior; directional reading still comes from structure and follow-through. A move outside the upper band can appear during strength, exhaustion, news-driven volatility, or a temporary range break. A move outside the lower band can appear during weakness, capitulation, overshoot, or ordinary expansion. The band event needs context before it has meaning.
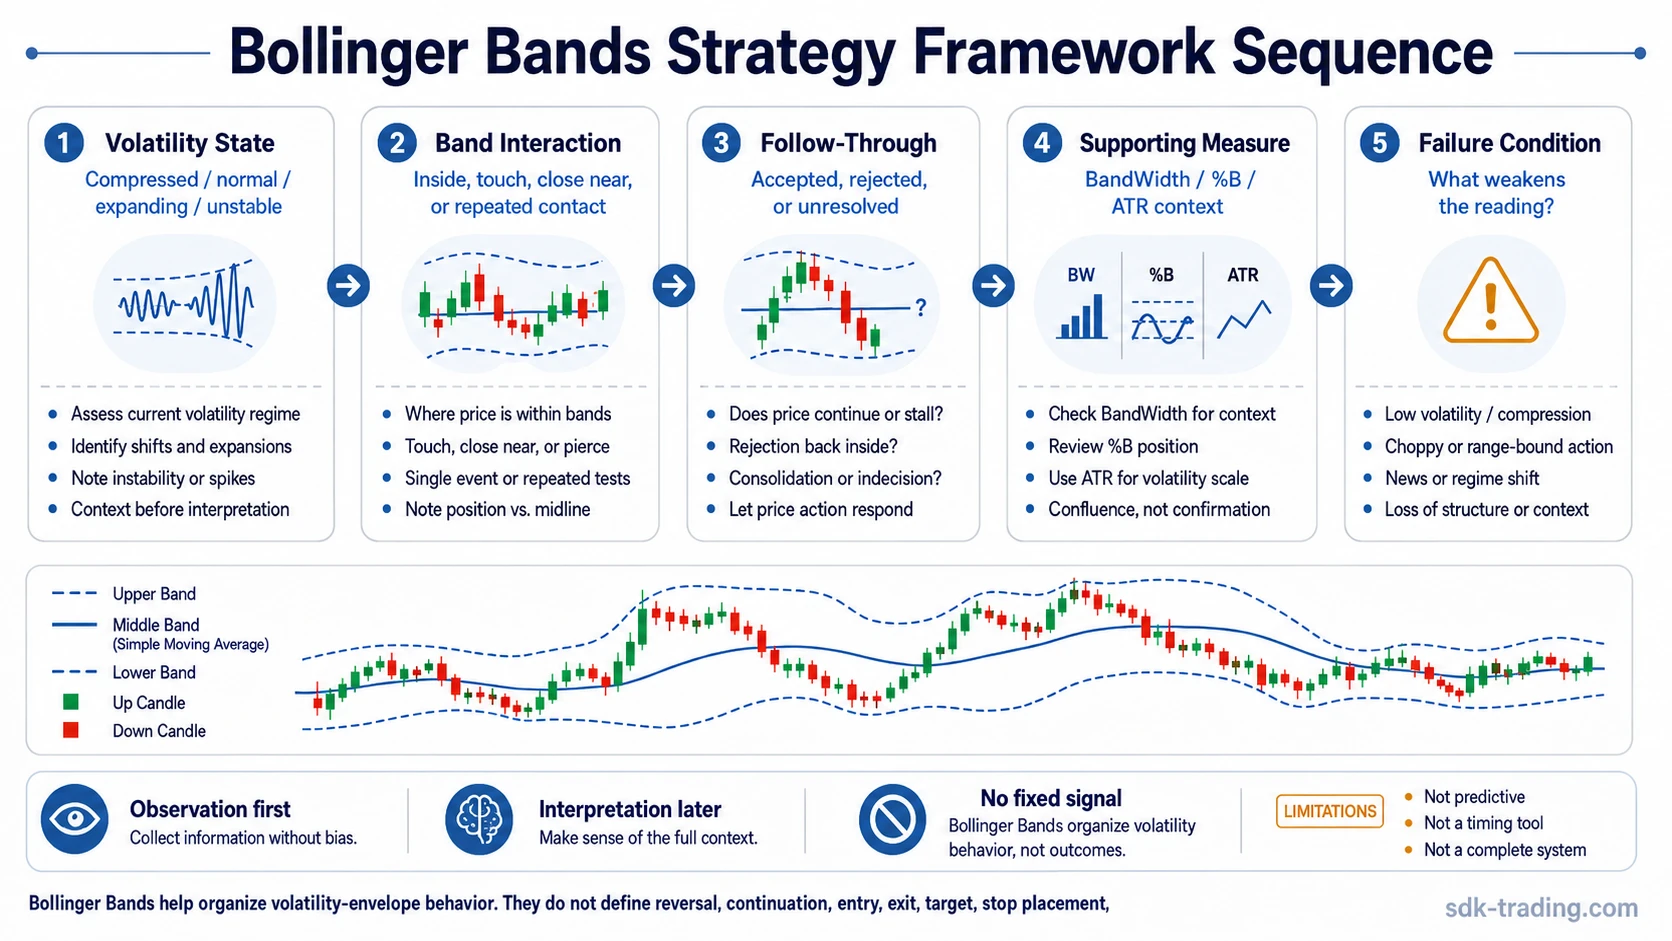
The Bollinger Bands Strategy Sequence
The framework starts with volatility state rather than direction. A compressed envelope tells a different story from a widening envelope. A band touch after tight compression has a different risk profile from a band touch after a long expansion. The sequence below separates observation from interpretation.
| Step | Question | Useful Reading | Boundary |
|---|---|---|---|
| 1. Volatility state | Are the bands compressed, normal, or expanding? | Defines whether the market is quiet, widening, or unstable. | Compression does not forecast breakout direction. |
| 2. Band interaction | Is price touching, closing near, or walking along an outer band? | Shows where price sits relative to the envelope boundary. | A single touch is only an observation. |
| 3. Follow-through | Does price accept the area or reject it? | Separates temporary overshoot from sustained pressure. | One candle outside the band can be noise. |
| 4. Supporting measure | Do BandWidth, %B, or ATR clarify the condition? | Connects band behavior with measurable volatility and range context. | One measure cannot carry the whole reading. |
| 5. Failure condition | What would make the interpretation weaker? | Prevents the band event from becoming a fixed belief. | The reading must change when price behavior changes. |
Band Touch, Band Walk, and Squeeze Conditions
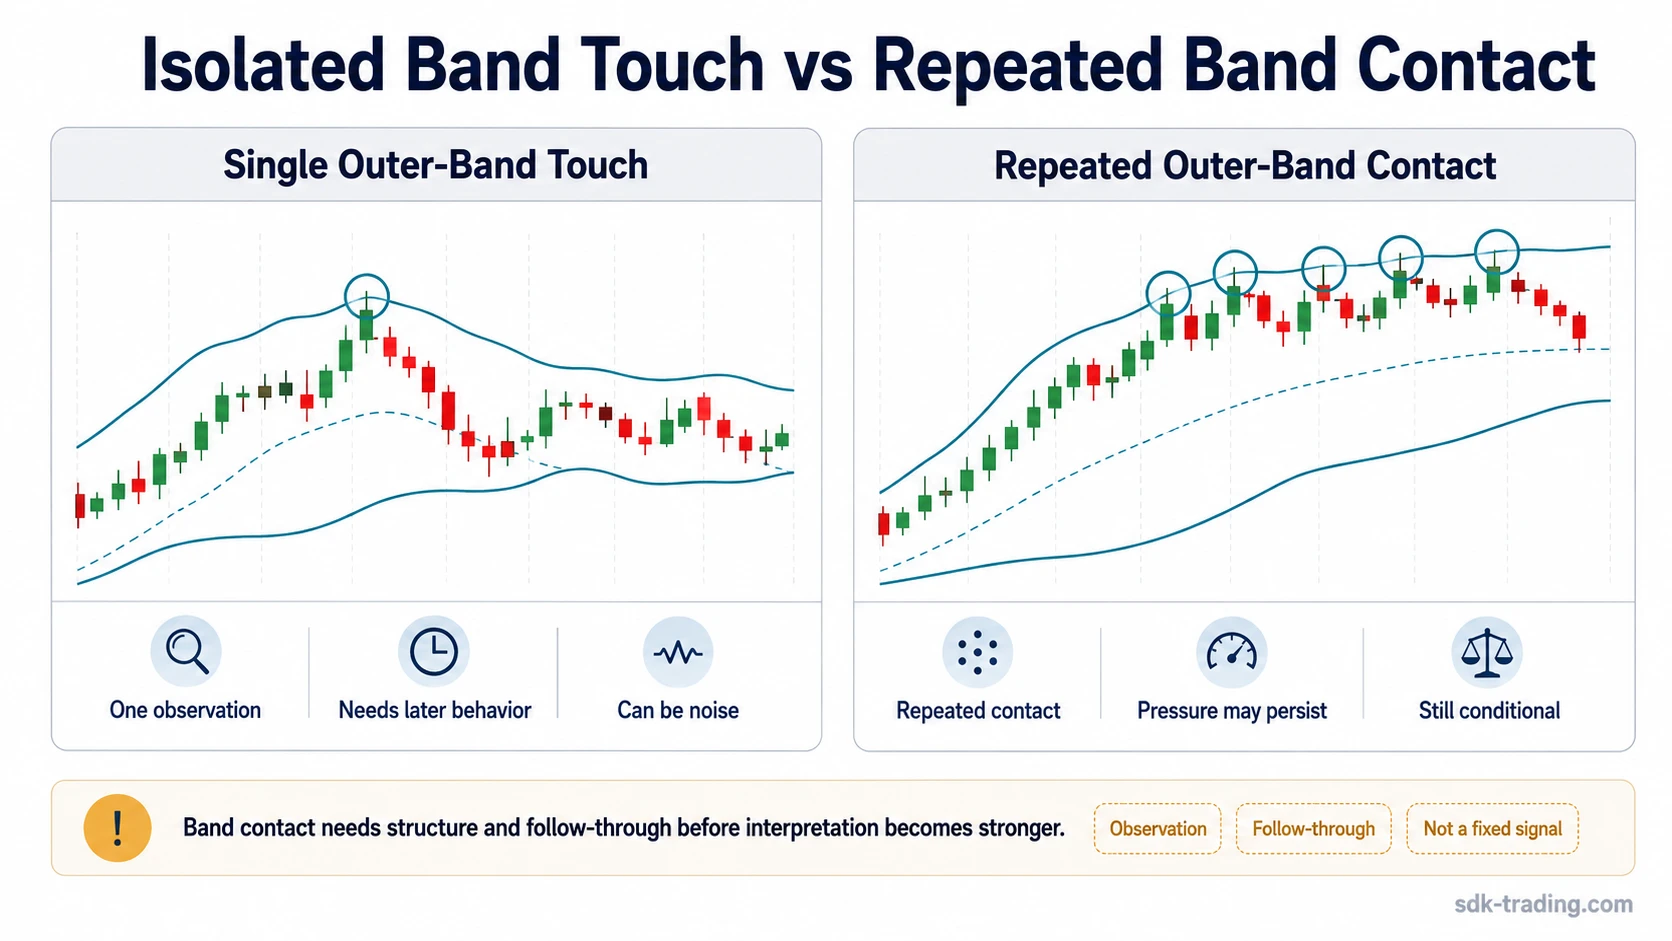
Band contact has to be separated into different behaviors. An isolated upper-band touch can occur when price briefly stretches above its recent dispersion range. That stretch can fade, continue, or simply reset the envelope. Later structure determines whether the contact was accepted, rejected, or only temporary.
Repeated contact is different. When price repeatedly holds near the outer band, the market may be showing persistent pressure in that direction. This is often called a band walk. The important distinction is that repeated contact remains conditional. It becomes more useful when the move has acceptance, structure, and follow-through. It becomes weaker when price repeatedly pierces the band and then fails to hold outside or near it.
A Bollinger Band Squeeze describes a compression condition. Narrow bands show that recent dispersion has contracted. That can prepare the market for expansion, but the squeeze itself does not decide the direction of expansion. Its value improves only after expansion begins and price shows where acceptance is developing.
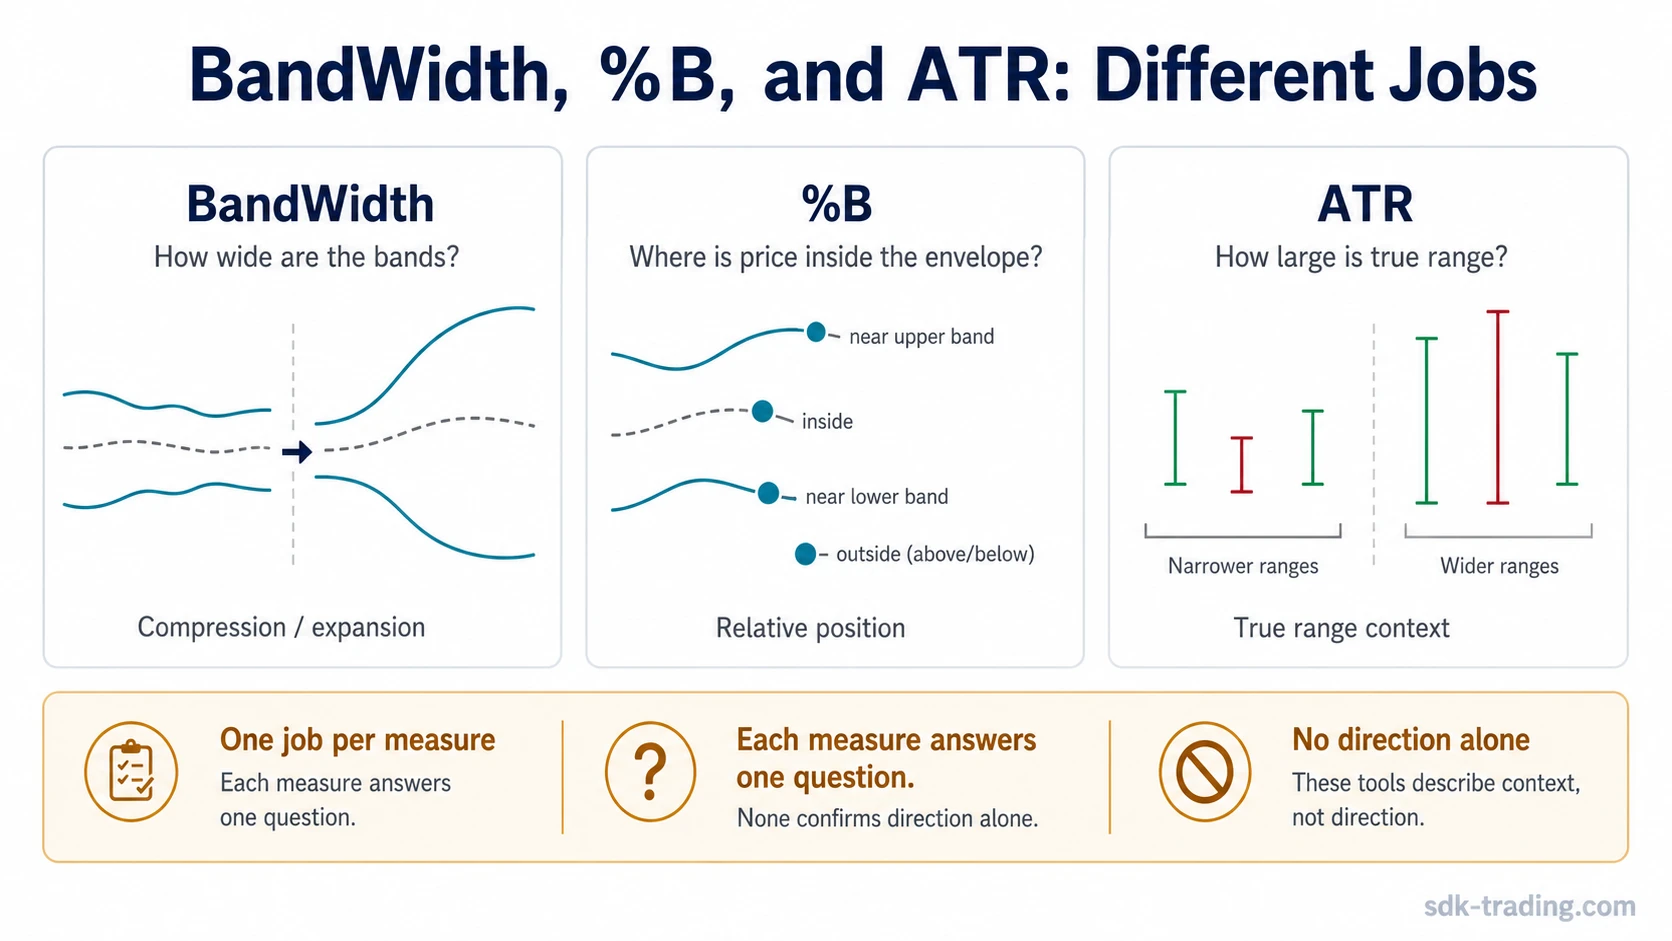
Where BandWidth, %B, and ATR Fit
Each supporting measure answers a different question. The mistake is to stack indicators until one appears to agree with the desired view. A cleaner process assigns one job to each measure and avoids treating any single reading as complete proof.
| Component | Primary Job | Useful In The Framework | Not Enough To Conclude |
|---|---|---|---|
| Bollinger Bands | Envelope structure | Shows price behavior around standard-deviation boundaries. | Direction, reversal, continuation, or trade timing. |
| Bollinger Band Squeeze | Compression condition | Marks a narrower volatility envelope before possible expansion. | Breakout direction or quality. |
| Bollinger BandWidth | Band width measurement | Helps compare compression and expansion across time. | Whether price should continue or reverse. |
| Bollinger %B | Relative band position | Shows where price sits inside, near, or outside the bands. | Whether that position is actionable. |
| ATR | True range context | Helps separate envelope expansion from broader range expansion. | Directional bias by itself. |
BandWidth belongs near the compression and expansion question. %B belongs near the price-location question. ATR belongs near the range-behavior question. When those jobs are kept separate, the framework becomes easier to audit. When they are blended into one confirmation label, the reading becomes more fragile.
Application Path and Constraints
A disciplined Bollinger Bands strategy starts with classification before interpretation. The useful path is condition first, band behavior second, supporting measurement third, and failure boundary last. That order reduces the chance of forcing a directional view onto a normal volatility event.
| Observation | Useful Reading | Constraint |
|---|---|---|
| Bands narrow after a quiet period | Volatility has compressed. | Compression does not specify direction. |
| Price touches one outer band once | Price reached the envelope boundary. | One touch does not classify trend or reversal. |
| Price repeatedly holds near an outer band | Pressure may be sustained. | Follow-through and structure still matter. |
| Bands widen quickly | Dispersion is increasing. | Expansion can happen in unstable, failed, or directional moves. |
| Price snaps back inside the bands | The prior extension may have failed or paused. | The return inside the envelope is not automatically a reversal. |
Short Practical Scenario
Consider a market that spends several sessions with narrowing bands and small candles. BandWidth contracts, and price remains close to the middle band. The first expansion candle closes near the upper band. At that moment, the only defensible reading is that compression has shifted into expansion pressure. The direction is still unproven.
If the next candles remain near the upper band and pullbacks stay shallow, repeated contact may support a sustained-pressure reading. If price immediately falls back into the middle of the envelope and the bands stop widening, the first upper-band move becomes less useful. The same initial band contact leads to different interpretations because the later behavior changes the evidence.
Failure Conditions and Risk Boundaries
The biggest weakness of Bollinger Bands is over-interpretation. The visual boundary can make a move look extreme before the market has shown whether that extreme matters. Sideways chop, sudden news volatility, one-candle pierces, and settings sensitivity can all create band events that look meaningful but have limited interpretive value.
| Failure Condition | Why It Weakens The Reading | Safer Interpretation |
|---|---|---|
| Sideways chop | Price may touch both bands without a stable expansion sequence. | Treat band events as range noise until behavior becomes cleaner. |
| One-candle pierce | A single candle outside a band can reflect temporary volatility. | Use later behavior to evaluate whether the move was accepted, rejected, or only temporary. |
| Settings sensitivity | Different moving-average or standard-deviation settings can change how often price reaches the bands. | Do not treat a setting change as a better signal by default. |
| Volatility without structure | Wider bands can reflect instability rather than clean directional pressure. | Separate expansion from directional acceptance. |
| Indicator stacking | Adding RSI, MACD, or volume mechanically can create false confidence. | Use supporting tools only when each one answers a specific question. |
Using the Framework Without Turning It Into a Signal
A Bollinger Bands strategy becomes more useful when it remains a reading framework. The bands can show where price is stretched, compressed, or expanding relative to recent dispersion. They cannot replace structure, acceptance, invalidation, or risk control.
The strongest use is to ask a sequence of conditional questions: Is volatility compressed or expanding? Is band contact isolated or repeated? Is price accepted near the outer band or rejected back inside the envelope? Do BandWidth, %B, and ATR support the same volatility-state reading? What would make the interpretation weaker?
That keeps Bollinger Bands from becoming a fixed upper-band and lower-band rule. The framework is most defensible when the reading can change as market behavior changes.
FAQ
Is touching a Bollinger Band a trade signal?
No. Touching an upper or lower band only shows that price has reached or moved beyond the envelope boundary. The interpretation depends on volatility state, structure, repeated contact, and later acceptance or rejection.
What makes a Bollinger Band squeeze useful?
A squeeze is useful because it shows that recent dispersion has contracted. It can prepare the market for expansion, but it does not predict the direction of that expansion.
How does BandWidth fit into a Bollinger Bands strategy?
BandWidth helps measure whether the bands are narrowing or widening. It supports the volatility-state part of the framework, but it does not confirm reversal, continuation, or trade timing by itself.
Can Bollinger Bands define direction by themselves?
No. Bollinger Bands describe envelope behavior and dispersion around a moving average. Directional interpretation needs price structure, follow-through, and a clear condition that would weaken the reading.