Volatility indicators measure how much price is moving, how wide a price envelope is, or how much uncertainty the market is pricing. They describe range, dispersion, compression, expansion, or implied volatility conditions, but they do not establish direction, reversal timing, confirmation quality, or trade quality on their own.
Definition: Volatility indicators are technical or market-derived tools that summarize movement size, price dispersion, envelope width, channel range, or implied uncertainty. A volatility reading is a context reading, not a standalone trading conclusion.
The useful question is not only whether volatility is high or low. The safer question is what the indicator is measuring, which input created the reading, and whether separate market structure supports the interpretation.
What Volatility Indicators Measure
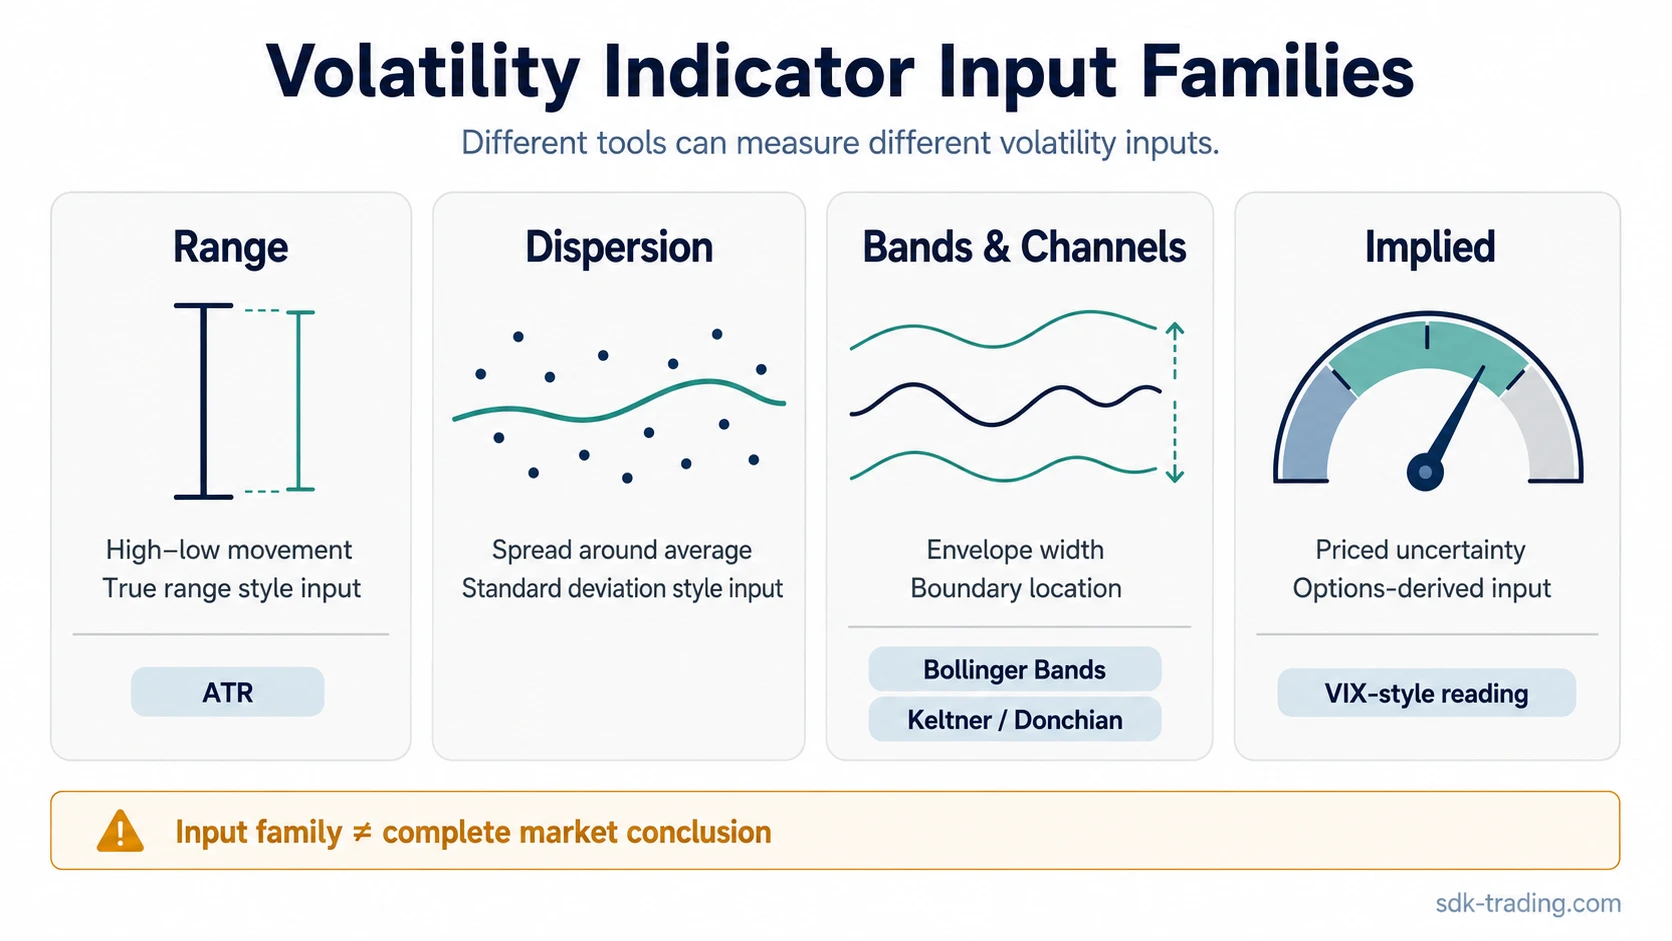
Volatility indicators usually describe amplitude. Some measure the distance price has traveled over recent bars. Others measure dispersion around an average, the width of a band or channel, or the uncertainty implied by options markets.
That difference matters because the same market can look volatile through one lens and less extreme through another. A range-based tool may react to large intraday movement, while a dispersion-based tool may react more strongly when closes spread away from an average.
| Input family | What it measures | Common examples | Main limitation |
|---|---|---|---|
| Range-based | Recent high-low or true-range movement | ATR, average true range style readings | Direction, reversal timing, or setup quality |
| Dispersion-based | How far price values are spread around a mean | Standard deviation style readings | Whether the next move must expand or reverse |
| Envelope or band-based | Distance between bands, channels, or price envelopes | Bollinger Bands, Keltner Channels, Donchian Channels | Whether a boundary touch is a complete signal |
| Implied-volatility based | Uncertainty priced through options or volatility products | VIX-style or implied volatility readings | Whether a trade is attractive or a move is guaranteed |
Why Different Volatility Indicators Can Disagree
Different volatility indicators can disagree because they are not measuring the same source of movement. A range indicator may rise after wide candles or gaps. A dispersion tool may rise when price closes farther from its average. A band or channel may widen when the envelope expands. An implied-volatility measure may move because options traders are pricing more uncertainty.
The ATR indicator is a range-based example. It can rise when price movement expands, but a higher reading does not say whether the next directional move should be upward, downward, or sideways.
Bollinger Bands use a moving average and standard deviation logic to create an envelope around price. Wider bands can show expansion, while narrower bands can show compression, but the directional reading still depends on separate price behavior.
Interpretation note: A volatility indicator should be read as a measurement lens. Before using the reading, identify whether it comes from range, dispersion, envelope width, channel distance, or implied uncertainty.
What Rising or Falling Volatility Can and Cannot Tell You
A volatility reading becomes more useful when it is tied to a specific condition. Rising volatility, falling volatility, widening bands, narrowing channels, or a high implied-volatility reading can all describe a market state. The interpretation still needs a separate reason.
| Condition | Possible implication | Key limitation |
|---|---|---|
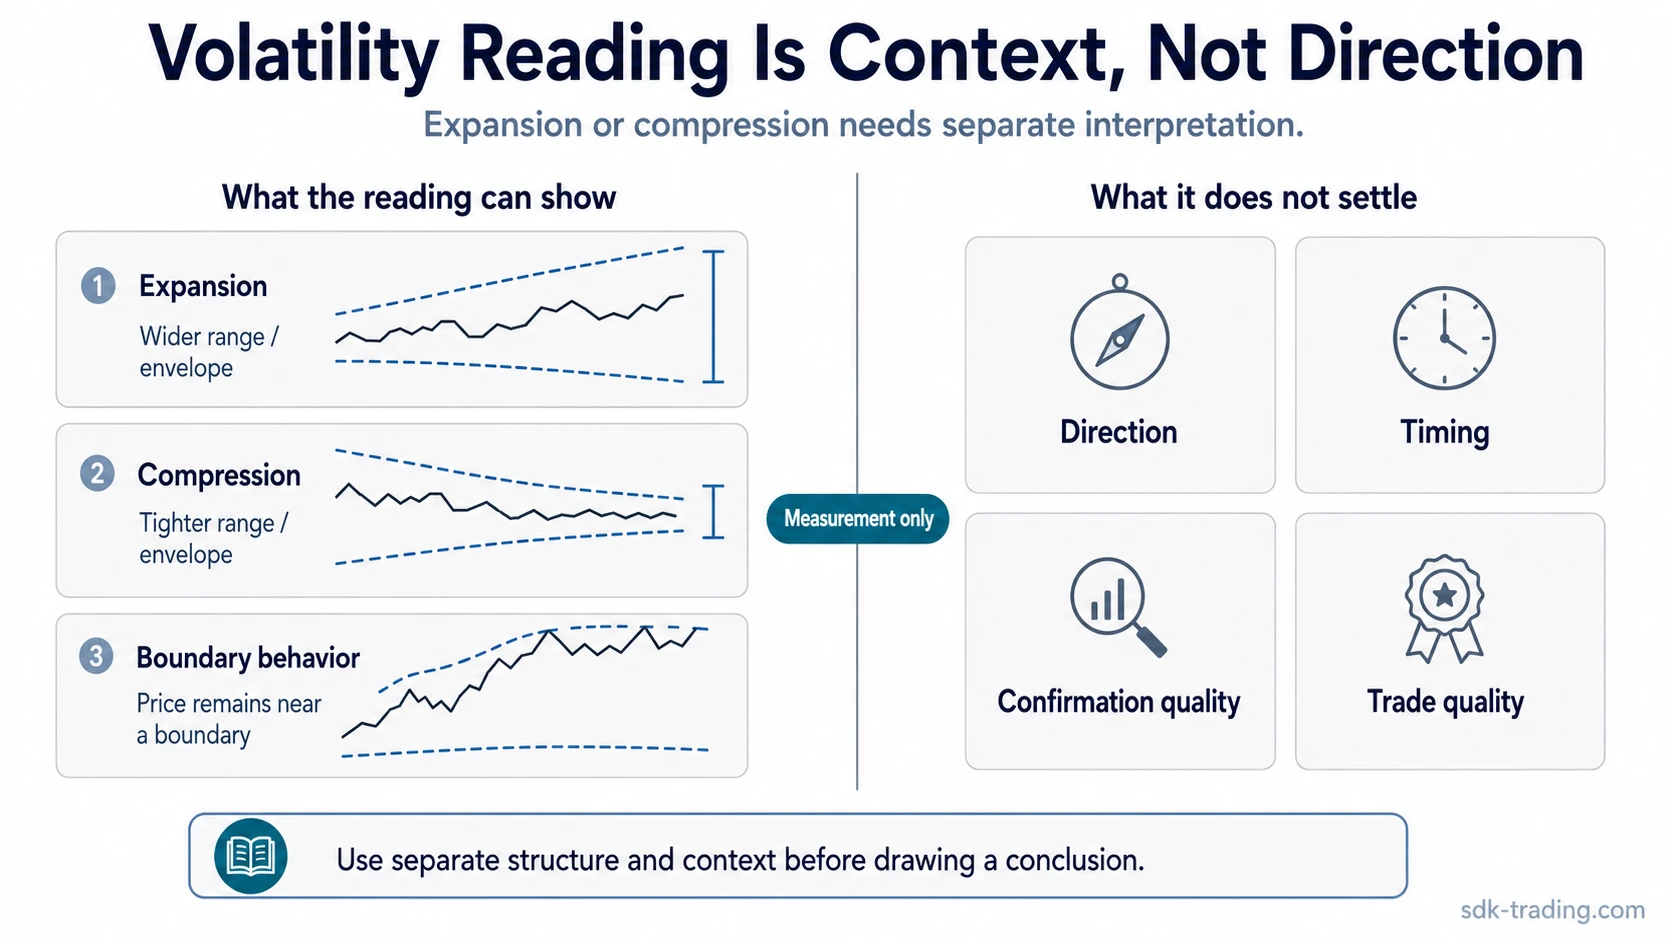
| Rising volatility | Movement size is expanding or uncertainty is increasing. | Expansion can happen during continuation, reversal, or disorderly chop. |
| Falling volatility | Movement size is contracting or the market is becoming quieter. | Compression does not identify the direction of any later expansion. |
| Wide bands or channels | The recent range or envelope has expanded. | A wide envelope does not mean price is exhausted. |
| Narrow bands or channels | The recent range or envelope has compressed. | A narrow envelope does not determine breakout direction or quality. |
| High implied volatility | Options markets are pricing greater uncertainty. | Higher implied uncertainty does not automatically create a good trade. |
| Low implied volatility | Options markets are pricing less uncertainty. | Low uncertainty pricing can persist and does not remove event risk. |
The reading is strongest when it answers a narrow measurement question. It becomes weaker when it is forced to answer a directional question it was not built to answer.
Common Misread: Treating a Volatility Reading as Confirmation
A common mistake is treating a high, low, widening, narrowing, or boundary reading as if it settles the next market outcome. Volatility can change before a directional move, during a directional move, after a shock, or inside a noisy range.
Common mistake: A trader sees widening bands or rising ATR and assumes the market has confirmed a breakout or reversal. The reading only says movement has expanded. It does not show that price accepted a new area, rejected a boundary, or created a clean directional structure.
Thresholds create the same problem. A high volatility threshold can warn that movement is larger than usual, but large movement can persist. A low volatility threshold can show compression, but compression can continue longer than expected.
False Confirmation Scenario
Example: Price moves strongly for several sessions, ATR rises, and a band envelope widens. The volatility reading shows that movement has expanded. It does not say whether price will continue, reverse, or settle into a wider range. A safer interpretation waits for separate evidence such as acceptance, rejection, structure, participation, or failed follow-through.
The same logic applies to compression. Narrowing bands or a quiet range can show that movement has contracted, but the reading does not decide which side of the range matters. The directional interpretation depends on later behavior, not on the compression reading alone.
Safer Interpretation Framework
A safer volatility reading starts with the input, then separates measurement from conclusion. The indicator can describe the environment, but the directional case needs evidence from structure, trend behavior, location, participation, or failed movement.
| Step | Question | Safer reading |
|---|---|---|
| 1. Identify the input | Is the reading based on range, dispersion, envelope width, channel distance, or implied uncertainty? | Different inputs answer different measurement questions. |
| 2. Name the condition | Is volatility rising, falling, wide, narrow, compressed, or expanding? | The reading describes the state, not the outcome. |
| 3. Separate direction | Has price shown acceptance, rejection, trend continuation, or failed movement? | Direction needs separate structure. |
| 4. Check persistence | Is the reading a one-bar spike, a sustained expansion, or a longer compression? | One reading is weaker than a repeated condition. |
| 5. Avoid signal stacking too early | Is the volatility reading being treated as confirmation before structure supports it? | Volatility supports context; it should not replace confirmation. |
How to Read Volatility Indicators Without Overstating Them
Volatility indicators are most useful when they define the market environment. High volatility can mean wider movement, larger ranges, or higher uncertainty. Low volatility can mean compression, quieter behavior, or reduced priced uncertainty. Both states can be useful, but neither state is automatically bullish or bearish.
Context changes the reading. Expansion after a clean directional move is different from expansion inside whipsaw. Compression near a structural boundary is different from compression in the middle of a range. A boundary touch during a strong trend is different from a boundary touch after failed continuation.
Limitation: Volatility indicators do not evaluate trade quality by themselves. They do not define entry quality, stop placement, reward-to-risk, invalidation, or whether the market has enough confirmation. Those questions require separate analysis.
The strongest use is comparative and contextual: identify what changed, which input changed, and whether price behavior supports the interpretation.
FAQ
Are volatility indicators bullish or bearish?
No. Volatility indicators are direction-neutral. They can show expansion, compression, range size, dispersion, or implied uncertainty, but they do not decide whether price should move higher or lower.
Which volatility indicator is best?
There is no single best volatility indicator for every condition. A range-based tool, a dispersion-based tool, a band or channel, and an implied-volatility reading answer different measurement questions.
Can volatility indicators predict reversals?
Volatility indicators can show conditions that sometimes appear near reversals, but they do not predict reversals by themselves. A reversal reading needs separate evidence from price behavior and structure.
Why can two volatility indicators disagree?
They may use different inputs. One tool may respond to high-low range, another to closing-price dispersion, another to band width, and another to options-implied uncertainty.
Is high volatility the same as high risk?
High volatility can increase uncertainty and movement size, but risk also depends on position size, liquidity, invalidation, time horizon, and the quality of the underlying setup.