An ATR strategy uses average true range to read range expansion and contraction, not to predict bullish or bearish direction. The useful role of ATR is to show whether price movement is becoming wider, quieter, or more unstable relative to recent range behavior. Direction still has to come from market structure, trend behavior, breakout context, or another directional lens.
Definition: An ATR strategy is a volatility framework that uses the average true range reading to classify current range conditions, adjust risk context, and test whether price movement has enough range support to matter.
Key Points
- ATR measures range magnitude, not direction.
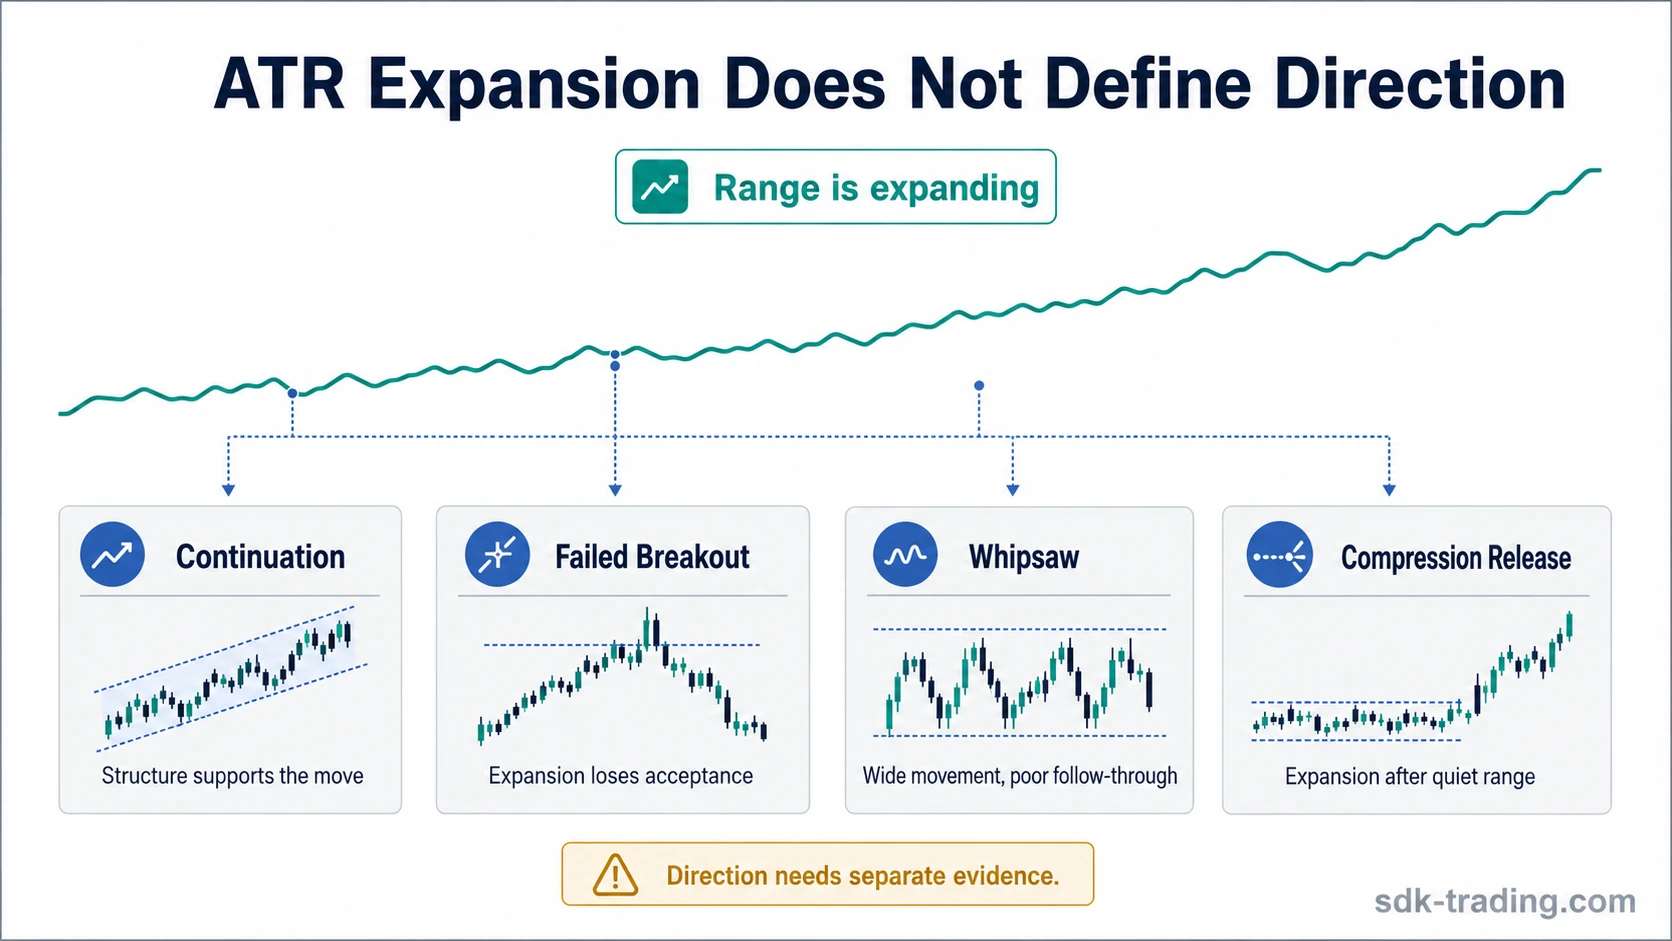
- Rising ATR can support an expansion reading, but it does not identify whether the move should be bullish or bearish.
- Low ATR can reflect compression, not safety.
- High ATR can reflect expansion, instability, or noisy movement depending on structure.
- A more controlled ATR strategy separates volatility state, structure, confirmation, and risk context before forming a market view.
What an ATR Strategy Actually Uses ATR For
ATR is a smoothed measure of true range. True range compares the current high-low range with gaps from the previous close, using the largest of high minus low, high minus previous close, or low minus previous close in absolute terms. The full calculation belongs with the ATR; the strategy use is different.
The practical question is not whether ATR is high or low in isolation. The question is whether current range behavior fits the surrounding price structure. A quiet market near a range edge, an expansion after compression, and a sudden volatility spike inside choppy price action can all produce different interpretations.
ATR becomes useful when it is treated as one input in a sequence. It can describe the size of movement, but it cannot decide direction, trend quality, breakout validity, or whether risk is acceptable by itself.
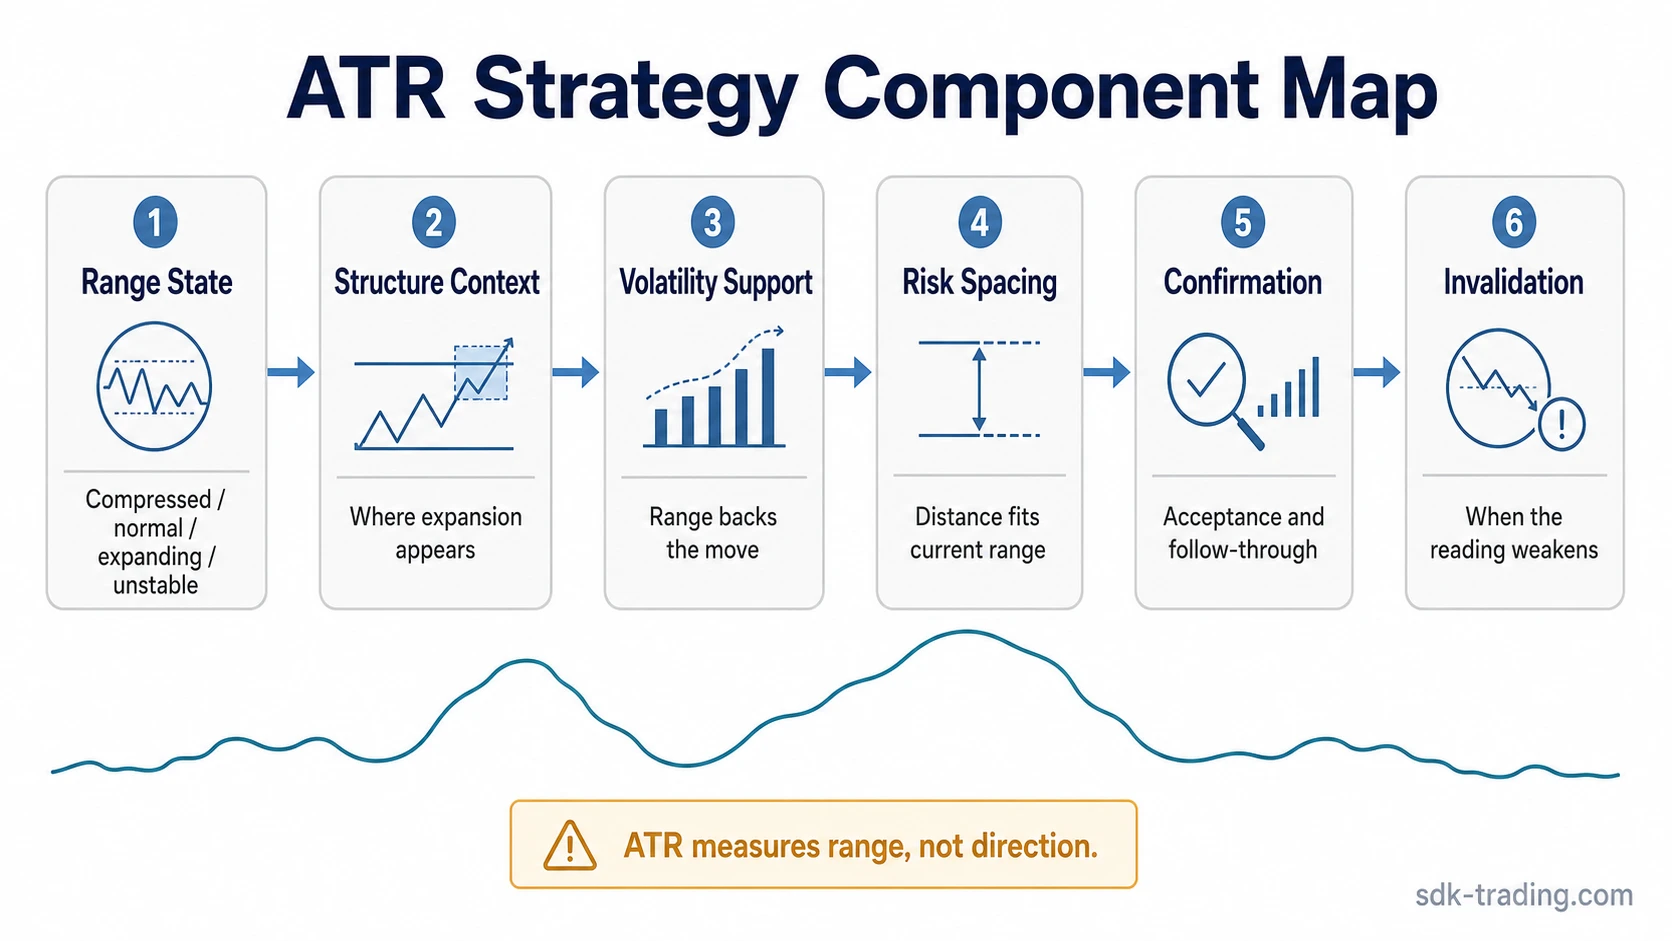
ATR Strategy Component Sequence
A controlled ATR strategy starts by separating range state from directional evidence. Volatility can expand before a trend continues, during a false breakout, or inside unstable noise. The sequence below keeps those jobs separate.
| Component | What ATR Contributes | What ATR Cannot Decide | Confirmation Needed |
|---|---|---|---|
| Range state | Shows whether movement is compressed, normal, expanding, or unstable. | Whether the market should continue in one direction. | Comparison with recent volatility behavior and current structure. |
| Structure context | Shows whether range is expanding near a meaningful area. | Whether that area will hold, fail, or become accepted. | Breakout, rejection, continuation, or failed acceptance behavior. |
| Volatility support | Shows whether movement has expanding or contracting range behind it. | Bullish or bearish bias. | Trend, market structure, price action, or another directional tool. |
| Risk spacing | Helps judge whether distance and exposure are proportional to current range. | The exact trade size, exit, or stop instruction. | Account risk rules, liquidity, structure, and invalidation logic. |
| Confirmation | Supports the idea that expansion is occurring. | Whether expansion is clean or durable. | Acceptance, follow-through, and absence of immediate failure. |
| Invalidation | Shows when volatility behavior stops supporting the premise. | The full reason to exit or reverse a view. | Structure failure, volatility collapse, unstable spikes, or range rejection. |
Using ATR as a Volatility Filter
ATR can filter market conditions by showing whether the current range is expanding or contracting relative to recent behavior. A low ATR environment often points to compression. That can precede expansion, but it can also remain quiet for longer than expected.
A rising ATR environment points to wider movement. That can support a breakout or continuation reading when price is also accepting beyond a meaningful structure. It can also reflect disorder if the expansion appears as overlapping candles, sharp reversals, and failed follow-through.
A volatility filter works best when ATR answers one question: is range behavior changing enough to adjust interpretation? It becomes weaker when it is used as a standalone trigger. Rising range is not the same as directional confirmation.
ATR, Stops, and Risk Context
ATR is often connected with stop distance because wider markets need more room than compressed markets. That does not make ATR a complete stop-loss method. It only gives context for how current movement compares with recent range conditions.
When ATR rises sharply, the same price distance may represent less protection than it did during a quiet regime. When ATR contracts, a tight distance may still be vulnerable if compression is building before expansion. The risk decision still depends on structure, liquidity, position sizing, and whether the trade idea has a clear invalidation point.
ATR can also help separate normal movement from abnormal movement. If price has to move unusually far against a view before the structure is invalidated, volatility context can expose whether the idea is becoming too wide, too unstable, or too dependent on hope.
ATR and Breakout or Continuation Confirmation
ATR can support breakout analysis when expansion appears after compression and price accepts beyond a meaningful boundary. The key word is support. ATR expansion can show that movement has more range behind it, but direction still comes from the structure being tested.
For example, a market that breaks above a range while ATR expands may be showing stronger participation than a market that breaks with no range change. The same ATR expansion becomes less reliable if price immediately falls back into the range or if the movement becomes erratic without clean acceptance.
Continuation readings work the same way. ATR can show that an existing move is gaining or losing range support, but it cannot prove that continuation will persist. The interpretation becomes stronger when range expansion aligns with trend structure and weaker when volatility rises inside choppy, two-sided movement.
ATR Strategy Use-Case Map
ATR has different roles depending on the decision being made. A cleaner use is to define what ATR can contribute, then keep separate tools responsible for direction, structure, and risk limits.
| Use Case | ATR Role | Main Constraint |
|---|---|---|
| Volatility filter | Classifies compression, normal range, expansion, or unstable range. | Does not define direction. |
| Position sizing context | Shows whether current movement is wider or quieter than recent conditions. | Does not replace account-level risk rules. |
| Stop-distance context | Helps judge whether distance is proportional to current range. | Does not provide a fixed stop rule. |
| Trailing exit context | Shows whether range expansion or contraction is changing the movement profile. | Does not decide exit timing by itself. |
| Breakout validation context | Tests whether a breakout has expanding range support. | Requires acceptance and structure confirmation. |
| Market selection | Helps separate quiet, active, and unstable instruments or periods. | Does not prove that an active market is cleaner or safer. |
When ATR Strategy Fails
ATR is lagging because it is built from prior range data. It can react after the volatility shift is already visible on the chart. That makes it useful for context, but weak as a prediction tool.
ATR has no directional bias. A rising reading can appear during bullish continuation, bearish continuation, panic movement, short covering, failed breakouts, or whipsaw conditions. The direction has to be judged separately.
A volatility spike is not the same as a durable regime change. One unusually wide candle or one gap can lift ATR temporarily, while the broader market remains unstable or directionless. A strategy that treats every spike as a new trend can mistake disorder for conviction.
Low ATR is not automatically safe. Quiet conditions can mean balanced trade, but they can also mean pressure is building before a larger expansion. High ATR is not automatically a trend. It can mean opportunity, but it can also mean slippage risk, emotional movement, and poor structure.
Limitation: ATR becomes most dangerous when it is asked to answer questions it was not designed to answer. It measures range behavior. It does not define direction, guarantee continuation, or turn volatility expansion into a complete trading decision.
ATR Strategy vs Other Volatility Tools
ATR focuses on range magnitude. Other volatility tools frame movement differently, so the choice of tool changes the question being asked.
| Tool | Main Question | How It Differs From ATR |
|---|---|---|
| Bollinger Bands | How far price is moving from a moving-average envelope. | Band position matters, not only raw range magnitude. |
| Bollinger Bandwidth | Whether the band envelope is compressing or expanding. | It tracks the width of Bollinger Bands rather than true range. |
| Donchian Channels | Whether price is testing recent high-low boundaries. | It emphasizes range boundaries rather than smoothed volatility magnitude. |
| ATR-based channel context | Whether price is moving around an ATR-influenced channel structure. | It combines volatility with a channel framework instead of using ATR alone. |
The cleanest distinction is simple: ATR measures how much price is moving; channel and band tools also show where price is moving relative to a visual envelope or boundary.
How to Use the Framework Without Turning ATR Into a Signal
A disciplined ATR strategy starts with range state, then asks whether structure supports the same interpretation. Compression can prepare a market for expansion, but the expansion still needs acceptance. A wider range can support continuation, but it can also mark unstable movement. A quieter range can reduce noise, but it can also hide pressure before expansion.
The useful sequence is: classify volatility, locate structure, apply a separate directional filter, judge risk spacing, look for confirmation, and define what would invalidate the reading. ATR is strongest when it helps size the market condition. It is weakest when it is treated as the market decision.
FAQ
Is ATR a bullish or bearish indicator?
No. ATR measures range magnitude. It can rise during bullish moves, bearish moves, failed breakouts, or unstable two-sided movement.
Can ATR support a breakout reading?
ATR can support a breakout reading by showing range expansion, but the breakout still needs structure, acceptance, and follow-through. ATR expansion alone is not confirmation.
Does low ATR mean a market is safer?
Not necessarily. Low ATR can mean quieter movement, but it can also reflect compression before expansion. Safety depends on structure, liquidity, and risk definition.
Should ATR be used alone in a trading strategy?
No. ATR is better used as a volatility component. Direction, confirmation, and invalidation need separate evidence.