Technical analysis is a market-analysis method that uses price, volume, charts, patterns, and indicators to interpret market behavior.
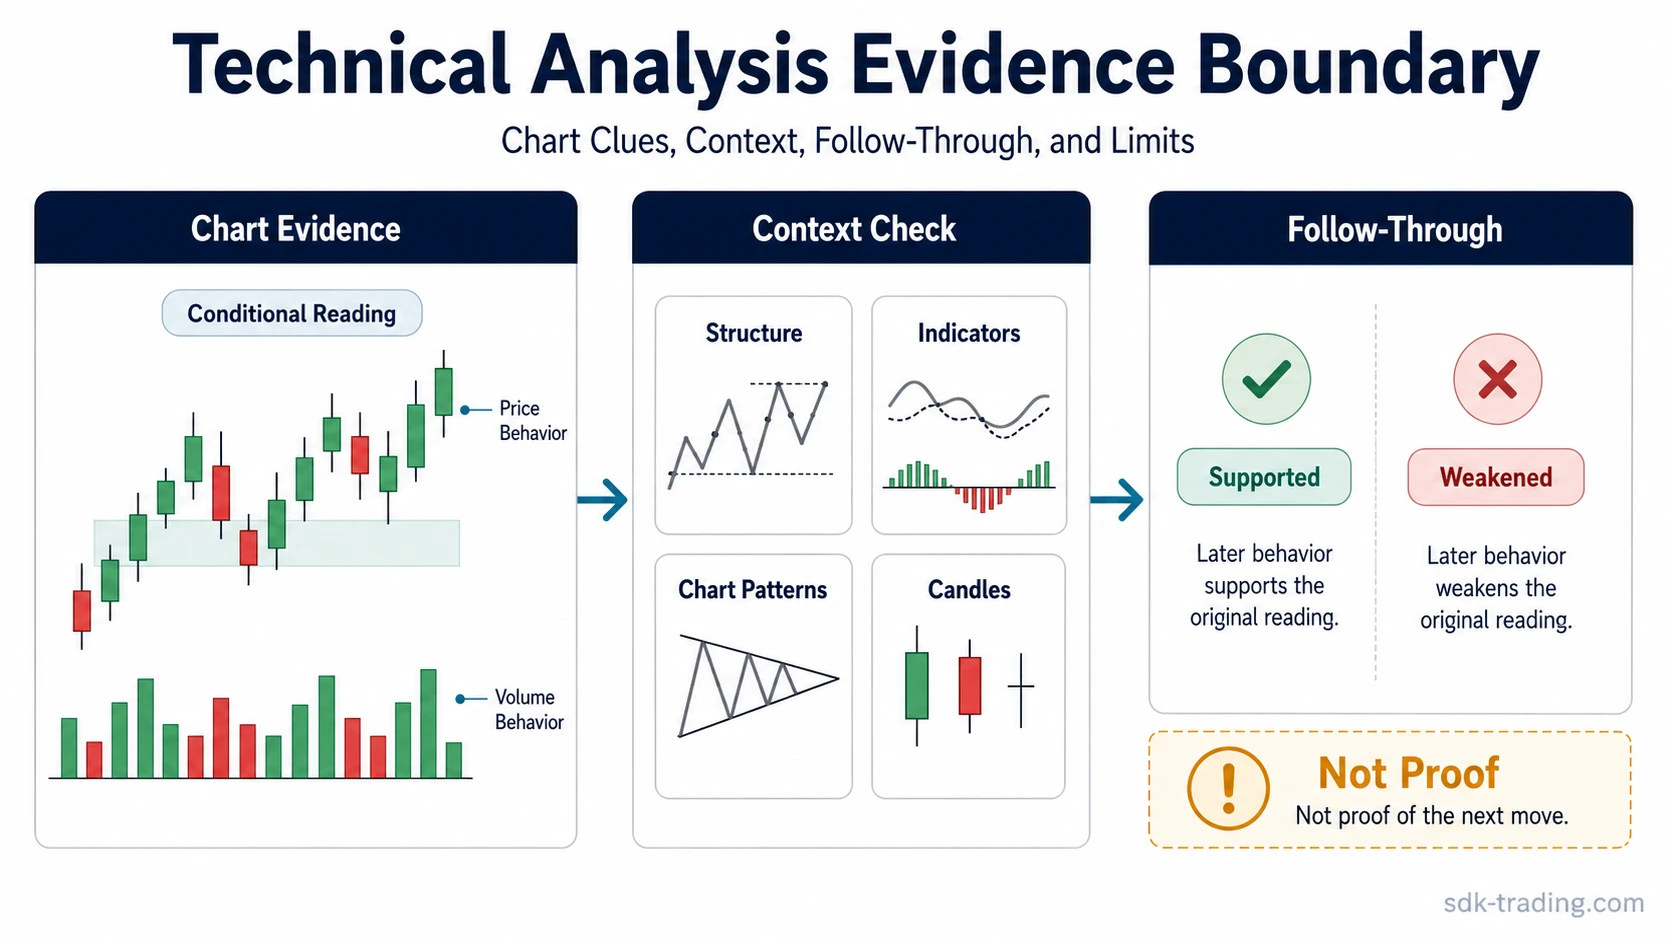
It organizes chart-based evidence, but it does not prove what price will do next. A technical reading is strongest when the chart evidence, market context, and follow-through point in the same direction. It weakens when price action rejects the original reading, volume fails to support it, or the signal appears in the wrong context.
Key Points
- Technical analysis studies price, volume, charts, patterns, and indicators.
- It interprets market behavior rather than business value or economic fundamentals.
- A technical reading remains conditional until context and subsequent price action support it.
- No indicator, candlestick, or chart pattern proves future price movement by itself.
What Technical Analysis Means
Technical analysis treats the market itself as evidence. Instead of starting with earnings, valuation, management quality, macro data, or balance-sheet strength, it starts with what buyers and sellers have already done in price and volume.The method assumes that market behavior leaves traces on charts. A trend, range, breakout attempt, reversal pattern, volume expansion, or failed retest can help describe how participation is changing. The evidence is interpretive, not conclusive. It can organize a market read, but it cannot remove uncertainty.
Technical Analysis Diagnostic Boundary
The useful boundary is not whether a chart clue exists. The useful boundary is what that clue can reasonably support. A single signal may start a question, but it does not finish the interpretation.
| Diagnostic area | Technical analysis can show | Technical analysis cannot prove |
|---|---|---|
| Price behavior | Trend, range, breakout attempt, rejection, acceptance, or failed continuation. | That the next move must continue in the same direction. |
| Volume behavior | Whether participation expands, fades, clusters, or appears during a key test. | That high or low volume has one fixed meaning in every context. |
| Indicators | Momentum, volatility, trend, breadth, or relative behavior depending on the tool. | That an indicator reading is a complete decision by itself. |
| Patterns | Recurring structures that may reflect accumulation, distribution, continuation, rejection, or exhaustion. | That a pattern label guarantees reversal, continuation, or a clean outcome. |
| Confirmation layer | Whether subsequent price and volume behavior support the original reading. | That confirmation removes risk or turns interpretation into certainty. |
| Failure condition | When the original read becomes less defensible because later behavior rejects it. | That every failed signal creates an opposite signal automatically. |
A technical clue starts the interpretation. Follow-through decides whether that interpretation remains useful, needs adjustment, or should be abandoned.
What Evidence Technical Analysis Uses
Technical analysis uses several evidence families. They often overlap, but each one answers a different kind of question about market behavior.
| Evidence family | What it helps interpret | Boundary |
|---|---|---|
| Price action and chart structure | Trend, range, breakout attempts, failed breaks, support and resistance levels, and acceptance behavior. | Structure needs context; a level or line is not proof by itself. |
| Volume | Participation, effort, pressure, absorption, exhaustion, or lack of follow-through. | Volume has to be read against price result, location, and prior behavior. |
| Indicators | Momentum, trend strength, volatility, breadth, or relative movement. | Indicators summarize market data; they do not replace market context. |
| Chart patterns | Recurring chart structures such as ranges, breakouts, reversals, and continuation formations. | A pattern label needs confirmation from behavior after the structure forms. |
| Candlestick patterns | Short-term pressure, rejection, indecision, expansion, or exhaustion inside a specific candle sequence. | Candles are a timing and context layer, not a complete trading system. |
Why Price and Volume Can Act as Market Evidence
Every traded price records where buyers and sellers were willing to transact at that moment. When prices rise, fall, stall, reject a level, or hold a range, the chart records how market participants behaved under changing conditions. This is where how to read stock charts becomes the practical next step from the broader technical analysis method.Volume adds a participation layer. A breakout attempt with expanding volume can suggest broader participation than a thin move. A sharp rejection with heavy volume can suggest that the tested area attracted meaningful opposing pressure. A quiet drift can mean something different from a move that appears after repeated failed attempts to advance.The interpretation depends on sequence. A breakout, retest, failed recovery, higher low, lower high, or volume expansion means little in isolation. The question is how the evidence fits together and whether price behavior accepts or rejects the first reading.
Technical Analysis vs Fundamental Analysis
Technical analysis studies market behavior shown through price, volume, charts, patterns, and indicators. Fundamental analysis studies business value, earnings, cash flow, valuation, management quality, economic conditions, and other drivers that may affect long-term worth.The distinction is practical. Technical analysis asks how the market is behaving. Fundamental analysis asks what an asset may be worth based on underlying drivers. For a deeper comparison, see technical analysis vs fundamental analysis. The two approaches can overlap in real decision processes, but they answer different questions.
| Method | Main question | Primary evidence | Main limitation |
|---|---|---|---|
| Technical analysis | How is the market behaving? | Price, volume, chart structure, patterns, and indicators. | It can organize interpretation, but it cannot prove future movement. |
| Fundamental analysis | What may the asset be worth? | Financial results, valuation, business quality, macro conditions, and economic drivers. | Value estimates can differ from market timing and can remain unresolved for long periods. |
Example of a Basic Technical Analysis Reading
The point is the separation between the first clue and the follow-through. Technical analysis reads both, rather than treating the first break as a finished conclusion.
What Technical Analysis Can and Cannot Show
Technical analysis can help organize evidence about trend, momentum, pressure, participation, and structure. It can help compare whether a market is accepting a level, rejecting it, compressing, expanding, or failing to follow through.It cannot prove what price will do next. A pattern can fail. An indicator can diverge without a clean reversal. A breakout can return inside the prior range. A strong-looking candle can lose meaning if the next sequence rejects it.
How Related Tools Fit Inside Technical Analysis
Technical analysis includes several method families, but each family deserves a separate level of detail. Indicators summarize market data. Chart patterns classify recurring structures. Candlestick patterns focus on shorter price sequences and candle-level pressure.Those branches can support a technical reading, but none of them replaces the full interpretation process. The stronger question is how the evidence families interact: where the pattern appears, what price has already done, whether volume supports the move, and whether follow-through confirms or weakens the reading.
| Related concept | How it fits inside technical analysis | Boundary |
|---|---|---|
| Indicators | Convert price, volume, volatility, or breadth data into a secondary reading layer. | They should not be treated as automatic decisions. |
| Chart patterns | Group recurring market structures into recognizable formations. | They need context and follow-through before the label becomes useful. |
| Candlestick patterns | Show candle-level pressure, rejection, expansion, indecision, or exhaustion. | They work best as part of structure, not as isolated signals. |
FAQ
Are indicators and chart patterns part of technical analysis?
Yes. Indicators, chart patterns, candlestick patterns, price action, support, resistance, trend, and volume can all belong to technical analysis when they are used as chart-based evidence.
What is the biggest limitation of technical analysis?
The biggest limitation is that chart evidence remains conditional. A signal, pattern, or indicator can weaken or fail when later price and volume behavior reject the original reading.
Can technical analysis be used without indicators?
Yes. Technical analysis can rely on price action, volume, structure, and support or resistance without adding indicators. Indicators are one evidence family, not a requirement.