Core principles of technical analysis become useful only when price behavior makes them testable assumptions rather than fixed conclusions.
The main principles are simple: price reflects available information and supply-demand pressure, price can move in trends, and market behavior can repeat or rhyme. Their value comes from how they guide observation, not from treating them as proof that price must move in one direction.
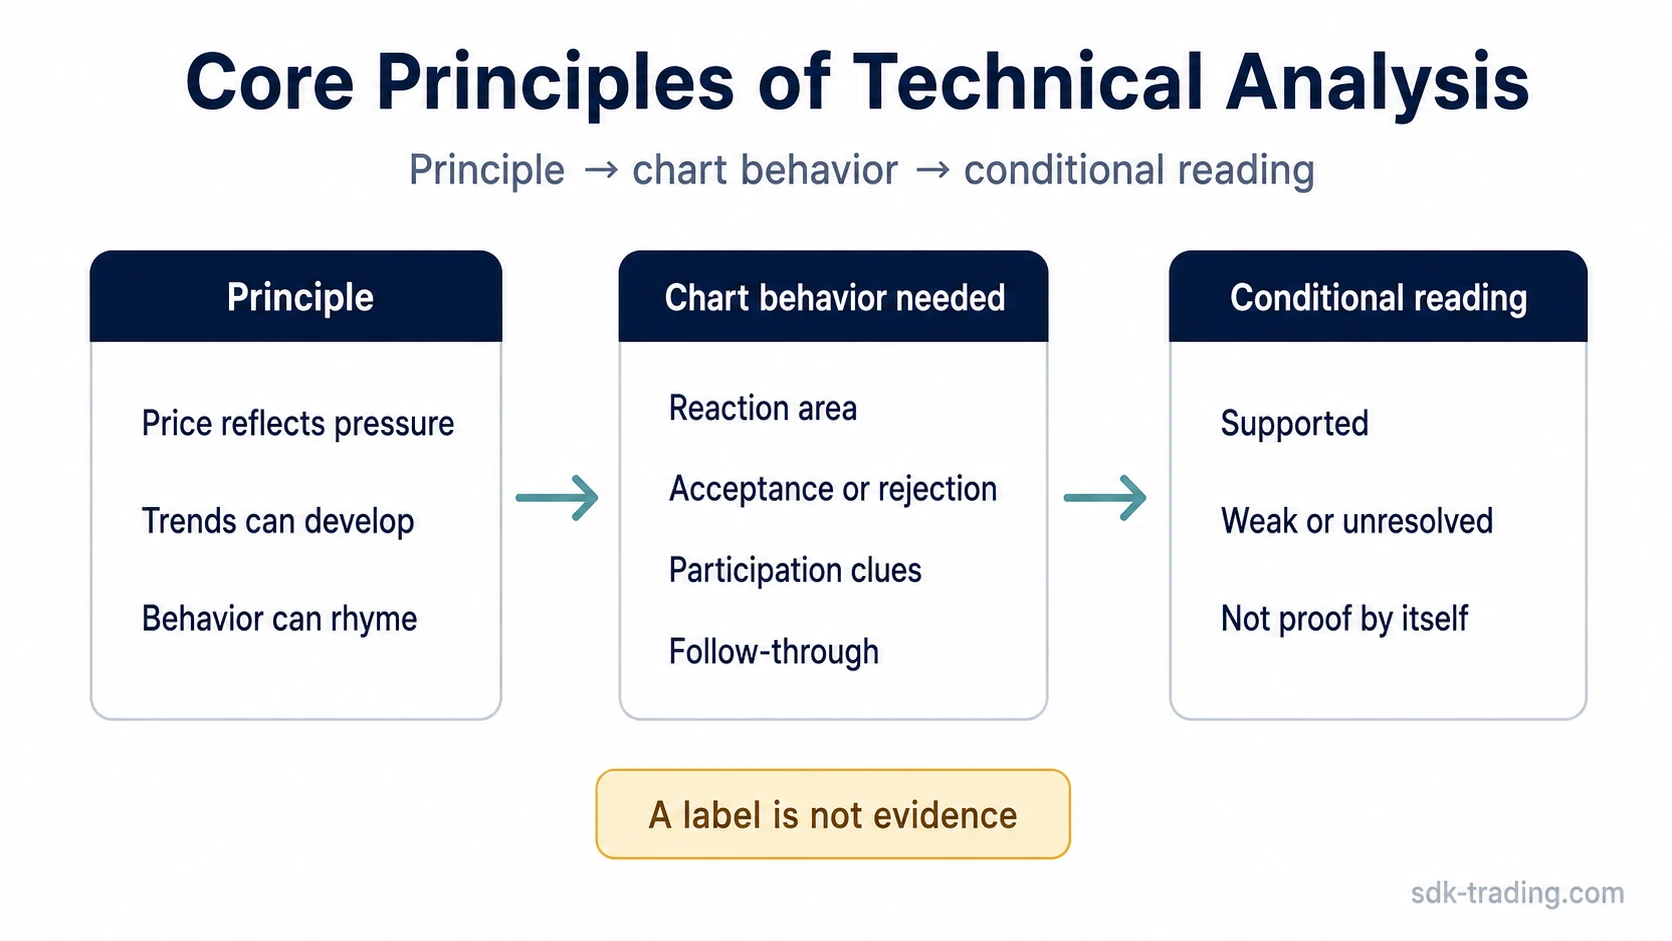
Core idea: The principles of technical analysis are working premises for reading price behavior. They do not predict direction by themselves; they help organize the evidence a trader reviews before forming a chart-based interpretation.
Author’s note: Technical analysis is a probability framework, not a guarantee system. Even when several tools point in the same direction, the useful question is still whether the balance of evidence supports one scenario more than another.
What the core principles of technical analysis actually assume
The three classic principles are best understood as assumptions that need confirmation from the chart. They describe what may be true about price behavior, not what must happen next.
- Price reflects available information and supply-demand pressure: price action can show how participants are responding to known information, expectations, positioning, and liquidity conditions.
- Price can move in trends: a market can continue in one direction when participation, acceptance, and structure support that movement.
- Behavior can repeat or rhyme: similar price structures can appear because market participants often react to uncertainty, pressure, and opportunity in recurring ways.
These assumptions become stronger when price, volume, range behavior, closes, failed attempts, and follow-through point in the same direction. They become weaker when the chart only offers a label without confirming behavior.
The evidence needed before a principle becomes useful
Each principle needs observable chart behavior before it can support a reading. The evidence usually comes from reactions around meaningful areas, acceptance or rejection, participation, and follow-through.
| Principle | What it assumes | Evidence needed | Common misread | Safer interpretation |
|---|---|---|---|---|
| Price reflects information and supply-demand pressure | Price behavior can reveal how participants respond to available information and pressure. | Clear reaction around meaningful areas, visible acceptance or rejection, volume or participation clues, and follow-through after the reaction. | Assuming every price move fully explains the market’s real condition. | Price is the observable result, but the quality of the reaction decides whether the reading is more testable or still unresolved. |
| Price can move in trends | Directional movement can persist when participation and structure support continuation. | Repeated higher or lower structural points, accepted movement beyond prior boundaries, controlled pullbacks, and continuation attempts that hold. | Calling any sharp move a trend before structure has developed. | A trend reading becomes harder to defend until the market shows directional acceptance, not just speed. |
| Behavior can repeat or rhyme | Similar patterns can appear because participants often respond to pressure in recurring ways. | A comparable structure, similar boundary behavior, failed acceptance, renewed participation, and follow-up behavior that supports the comparison. | Expecting an old pattern to produce the same result mechanically. | Historical resemblance is only a clue. Current structure decides whether the comparison has value. |
Evidence boundary: A principle is not enough on its own. The reading becomes stronger only when price reacts around a meaningful area and later behavior either supports or challenges the original interpretation.
Where the principles are commonly misread
The principles are commonly misread when they are treated as laws. Technical analysis becomes less useful when a label replaces observation, or when a single candle, indicator, or pattern is asked to carry more meaning than the chart supports.
| Misread | Why it creates risk | Better reading standard | Author’s practical note |
|---|---|---|---|
| Assuming a trend too early | A fast move can be a reaction, short-covering, liquidation, or temporary imbalance rather than a confirmed trend. | Look for structure, acceptance, pullback behavior, and continuation quality before treating the move as directional control. | Timeframe matters. A sharp move on a lower timeframe may be only a small part of a monthly structure. At the same time, lower timeframes can show early reversal behavior before the higher timeframe clearly confirms it. |
| Treating “history repeats” literally | Markets can form similar structures under different participation, volatility, and liquidity conditions. | Use past patterns as comparison points, then require current chart behavior before trusting the analogy. | A monthly resistance area that rejected price several times can raise the probability of another reaction, but it still does not guarantee rejection. The next test can also break through if structure and participation change. |
| Letting indicators replace evidence | Indicators usually summarize price or volume behavior after it has already occurred. | Use indicators as supporting context, not as proof that a principle has been confirmed. | RSI can stay overbought for weeks or months during a strong trend. An overbought reading is not automatically bearish, and a lower-timeframe RSI extreme may mean something different from a daily, weekly, or monthly reading. |
| Reading a pattern without boundary behavior | A pattern label can hide the question that matters: did price accept, reject, or fail around a meaningful area? | Focus on the boundary, the close, the reaction, and the follow-through before assigning meaning. | A cup-and-handle structure is not activated just because the shape looks familiar. The key question is whether price breaks the relevant boundary, closes through it, accepts above it, and avoids a failed breakout back into the structure. |
How these principles support technical analysis
In the broader technical analysis framework, these principles define what chart evidence is trying to test. Price behavior is observed first, then the principle is applied only if the evidence supports it.
That order matters. A trader does not need to believe that every chart pattern predicts the future. A more disciplined approach is to ask whether price is showing acceptance, rejection, continuation, failed continuation, or loss of control around a meaningful area.
Working sequence: observe the market structure, identify the assumption being tested, check whether price behavior supports that assumption, then keep the interpretation conditional until later behavior confirms, weakens, or leaves it unresolved.
Probability, scenarios, and why agreement is still not certainty
Technical analysis works best when different tools are treated as scenario evidence rather than final verdicts.
Even if ten different tools suggest that price is weakening, price can still rise. That does not make every tool useless. It means the tools are not verdicts. They are probability markers. Their job is to help the trader decide which scenario has more support, which scenario has less support, and what would change the interpretation.
Scenario boundary: A strong technical reading should still leave room for alternative paths. The useful output is not “this must happen.” The useful output is “this scenario currently has more evidence, but it weakens if the chart starts accepting the opposite behavior.”
How technical analysis works on a real chart: Silver and SLV
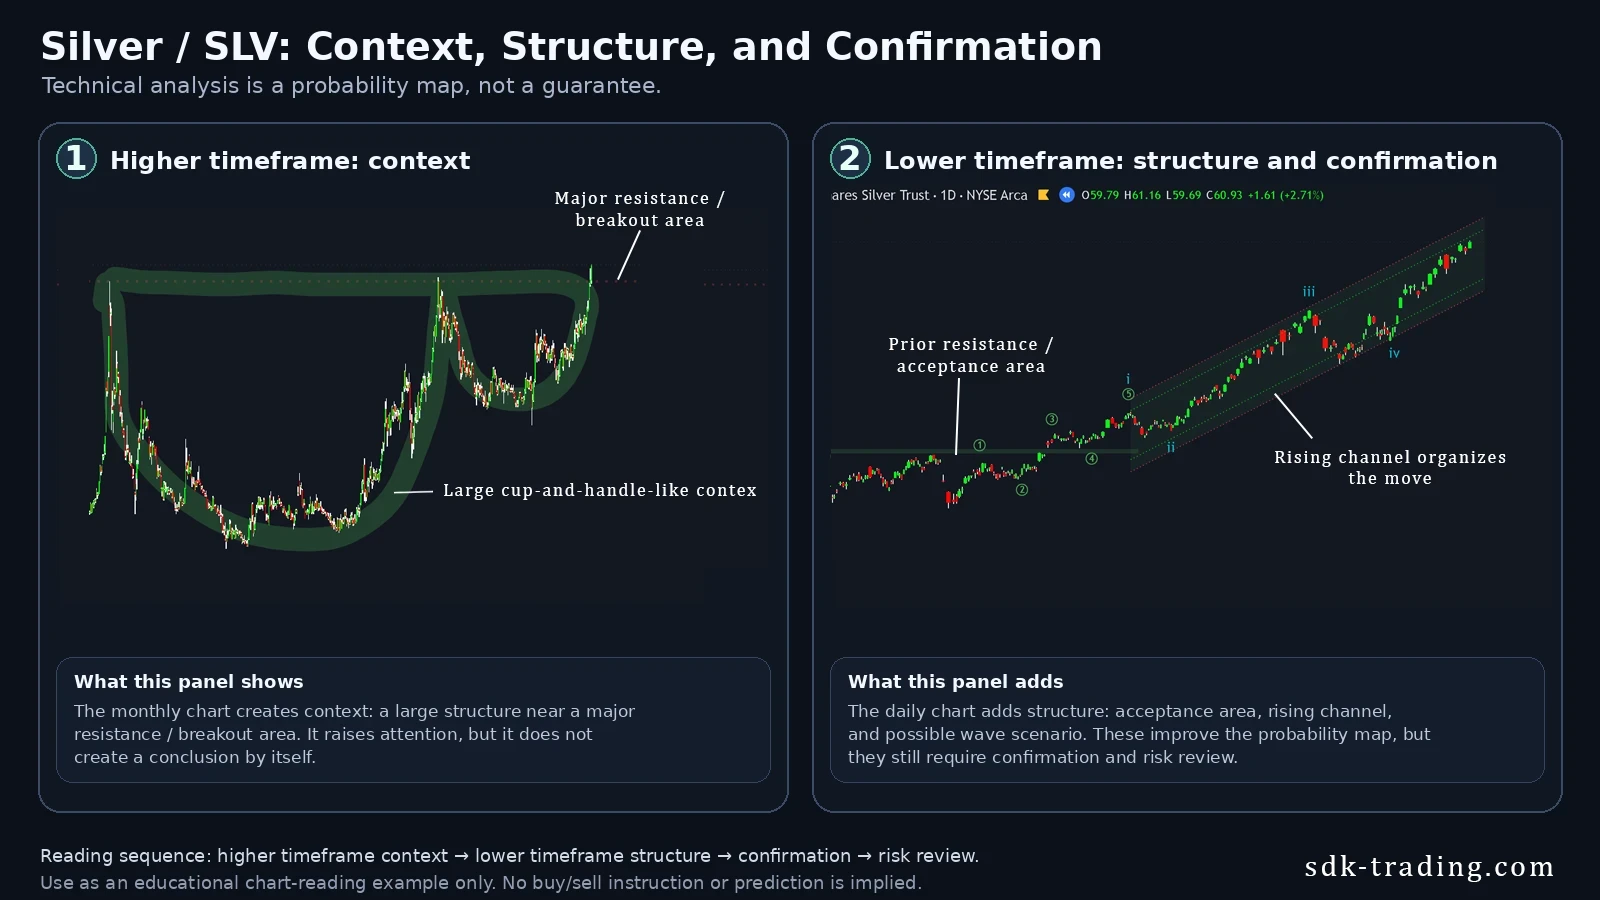
Silver and SLV provide a useful example of how technical analysis can move from broad context to lower-timeframe structure. The monthly silver chart shows a large rounded structure with a handle-like consolidation near a historically important resistance area. That higher-timeframe pattern does not create a standalone signal, but it explains why the asset deserves closer attention.
The daily SLV chart then adds a second layer. Price moved through a prior resistance area, formed a rising channel, and developed a possible wave structure inside that move. These details make the reading more specific, but they still do not guarantee continuation. They only show that the higher-timeframe idea has started to receive lower-timeframe structural support.
The important point is the sequence. The monthly chart gives context. The daily chart shows structure. The channel organizes the move. The possible wave count adds one scenario. The upper part of the channel also introduces stretch risk. Together, these layers increase the quality of the reading, but the final conclusion remains probabilistic.
| Layer | What the chart showed | Why it helped | Why it was not a guarantee |
|---|---|---|---|
| Higher timeframe | Silver formed a large cup-and-handle-like structure near a major resistance area. | It created broad context and explained why the chart deserved attention. | A large structure can still fail if price cannot break and accept above the boundary. |
| Lower timeframe | SLV moved through a prior resistance area and began organizing inside a rising channel. | It gave more detailed evidence that the higher-timeframe idea was receiving structural support. | A channel can break, flatten, or turn into distribution if follow-through weakens. |
| Wave scenario | The daily move could be read as a possible wave sequence inside the channel. | It helped organize the trend into a scenario instead of reading every candle separately. | A wave count is conditional and must be updated if price behavior contradicts it. |
| Risk review | Price moved toward the upper part of the channel after a strong advance. | It showed strength, but also made stretch and late-move risk more visible. | A strong trend can continue, but stretched movement can also become less stable. |
Transferable lesson: The value of technical analysis is not in one perfect signal. It is in building a layered reading: higher timeframe context, lower timeframe structure, signal quality, confirmation, and risk. The more layers agree, the stronger the scenario becomes, but it remains a scenario rather than a certainty.
When there is not enough evidence
Not every chart provides a useful technical reading. Sometimes price is too compressed, boundaries are unclear, volume does not add context, or later behavior contradicts the first interpretation.
- No clear boundary: acceptance and rejection are difficult to judge when the relevant area is not visible.
- No follow-through: a reaction has less meaning if later price action does not support it.
- Conflicting participation: volume, range, and close location may point to mixed behavior rather than a clean reading.
- Pattern without context: a familiar formation can be weak if it appears in the wrong location or lacks participation evidence.
- Timeframe conflict: a lower-timeframe reversal can appear before the higher timeframe confirms it, while a lower-timeframe move can also be too small to change the larger trend.
Practical limitation: The safest classification may be unresolved. A chart does not always need an immediate directional interpretation.
FAQ
Are the core principles of technical analysis predictions?
No. They are assumptions used to interpret chart evidence. A principle can support a reading only when price behavior makes the assumption testable, and even then the result remains probabilistic rather than guaranteed.
Does “history repeats” mean the same pattern should work the same way every time?
No. Similar structures can appear under similar conditions, but each case still depends on current price behavior, participation, acceptance, rejection, and follow-through.
Can an indicator confirm a technical-analysis principle by itself?
No. Indicators usually summarize price or volume behavior. They can support a reading, but structure, participation, boundaries, timeframe, and later behavior still matter.