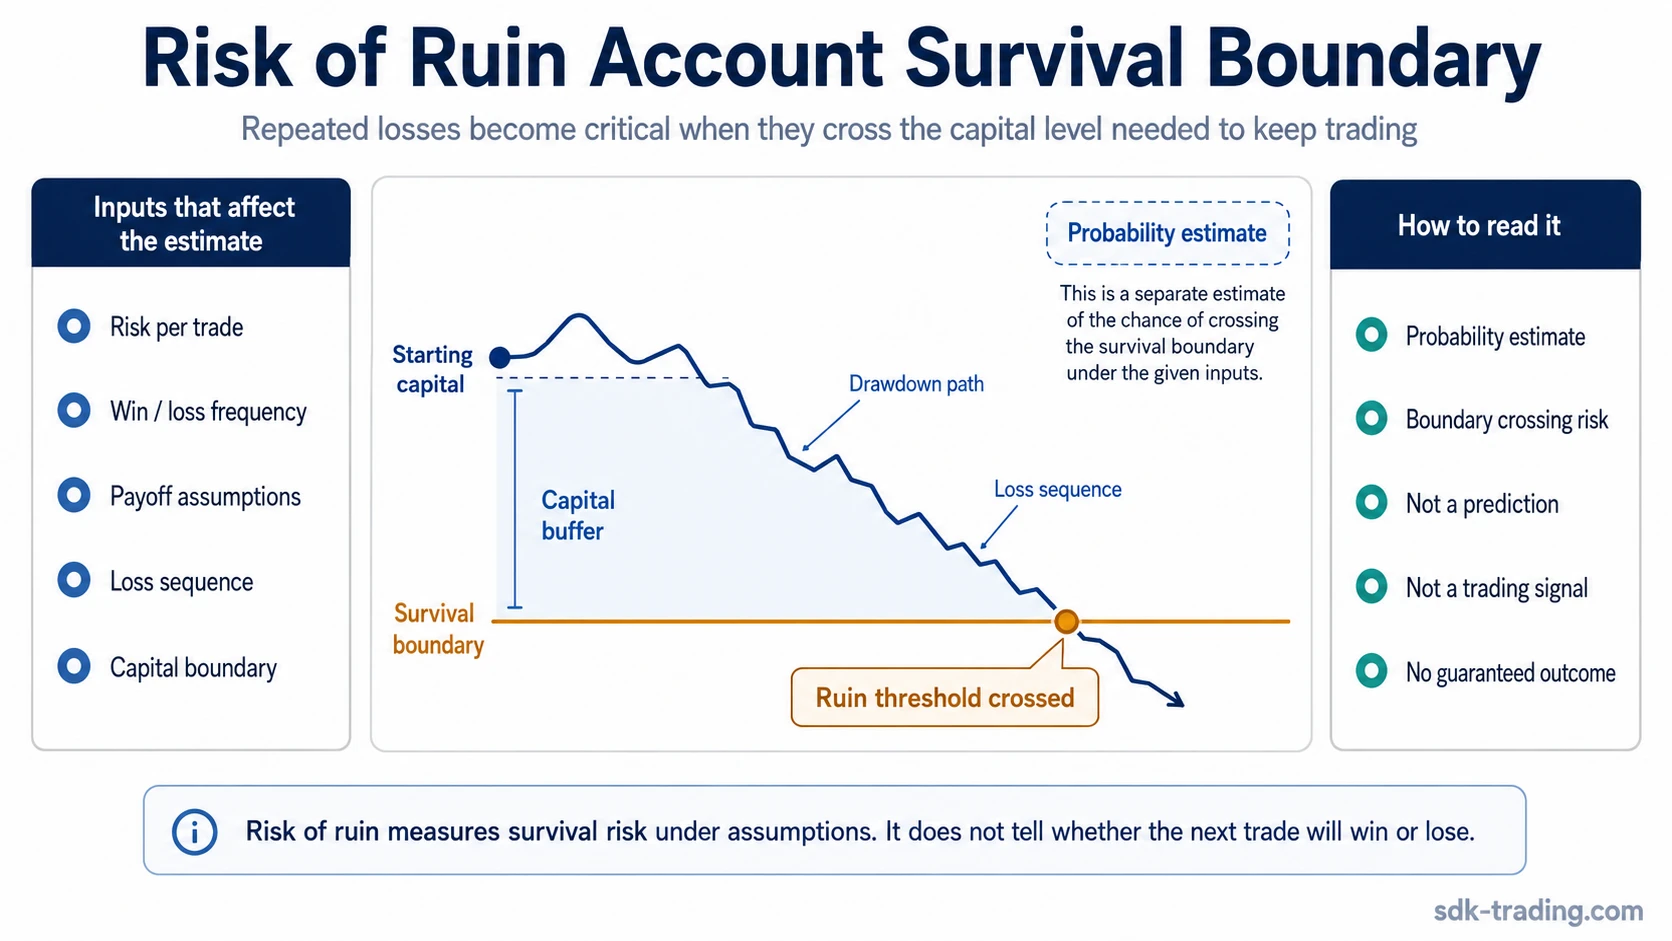
Risk of ruin in trading is the estimated chance that losses push an account below the capital level needed to keep trading or realistically recover.
Ruin does not have to mean the account reaches zero. In trading risk management, it can mean crossing a drawdown, margin, operating-capital, or recovery boundary where the same plan can no longer be followed safely.
The calculation depends on exposure size, win and loss frequency, payoff, losing streaks, trade count, and the capital level being tested. It is a risk measurement, not a market prediction, trading signal, or guarantee of future loss.
Definition: Risk of ruin measures the probability that a sequence of trading losses pushes capital below a defined survival boundary before the account can recover under the assumed trading model.
Key Points
- Risk of ruin is about account survival under repeated outcomes, not the result of one trade.
- The ruin boundary may be a maximum acceptable drawdown, margin constraint, minimum operating capital level, or recovery limit.
- Higher exposure, weaker payoff, lower win rate, longer losing streaks, and smaller capital buffers can raise the probability.
- A positive expectancy model can still carry ruin risk if position size is too large or losses cluster early.
- Calculator outputs are only useful when the inputs reflect realistic trading conditions.
What Is Risk of Ruin in Trading?
Risk of ruin is the probability that trading losses move an account below a level where the trader can no longer continue the same plan. That level can be literal account failure, but it is often more practical to define it as the point where recovery becomes unrealistic or behavior becomes unstable.
An account does not need to lose all capital before the plan breaks. A deep drawdown can force smaller position sizes, reduce flexibility, increase emotional pressure, or make the required recovery percentage much larger than the original loss.
The useful question is not only “Can the account reach zero?” It is “Can the account survive a realistic sequence of losses and still continue under the same risk plan?”
How Risk of Ruin Works
Risk of ruin comes from the interaction between capital, position exposure, trade outcomes, and sequence risk. A trading model can have favorable average results and still become fragile if the early loss sequence is large relative to account size.
Each loss reduces capital. If position size is not adjusted after losses, the next losing trade can represent a larger share of the remaining account and can move the account closer to the defined failure boundary.
- Capital sets the buffer: A larger buffer can absorb more adverse outcomes before the account reaches the tested level.
- Risk size controls damage speed: The larger the exposure per trade, the faster a losing sequence can reduce usable capital.
- Win and loss frequency shape streak risk: A system with frequent losses needs enough capital to survive normal losing runs.
- Payoff changes recovery pressure: Larger average wins can offset fewer wins, but only when the payoff input is realistic.
- The ruin boundary defines the test: The answer changes depending on whether ruin means a 20% drawdown, a 50% drawdown, margin failure, or total account loss.
That is why risk per trade is one of the most important inputs. It does not define risk of ruin by itself, but it controls how quickly a sequence of losses can damage the account.
Risk of Ruin vs Drawdown
Drawdown and risk of ruin are related, but they measure different things. Drawdown describes how far the account has fallen from a prior high. Risk of ruin estimates the probability that losses will cross a critical capital or drawdown boundary.
| Concept | What it measures | How to read it |
|---|---|---|
| Drawdown | The decline from a previous equity peak to a later low. | It shows the size of a loss path that has already happened or is being modeled. |
| Risk of ruin | The probability of crossing a critical capital or drawdown boundary. | It estimates account-fragility risk under assumed win rate, payoff, exposure, and sequence conditions. |
A drawdown number can be observed directly on an equity curve. Risk of ruin is a model-based probability built from assumptions about how trade outcomes may be distributed. The two should not be treated as interchangeable.
How to Read a Risk of Ruin Estimate
The strongest use of risk of ruin is diagnostic. It helps test whether the account structure can survive unfavorable trade sequences, not whether a specific trade should be taken.
| Diagnostic question | Safer interpretation |
|---|---|
| What it is | A probability estimate for crossing a defined survival or recovery boundary. |
| What it is not | It is not a prediction, signal, exact future loss path, or proof that an account will fail. |
| What raises it | Larger trade risk, weaker payoff, lower win rate, clustered losses, small capital buffers, or a stricter ruin definition. |
| What makes it unreliable | Unrealistic win rate, stale payoff inputs, changing position size, ignored fees or slippage, or failure to recalculate after drawdown. |
Inputs That Change Risk of Ruin
Risk of ruin changes when the inputs behind the trading model change. The important variables are not isolated; they interact across a sequence of trades.
| Input | Why it matters |
|---|---|
| Account size | A larger account buffer can absorb more adverse outcomes before reaching the tested capital level. |
| Risk per trade | Higher exposure per trade increases the speed at which a losing streak can damage capital. |
| Win rate and loss rate | The frequency of wins and losses affects how often the account may face extended losing runs. |
| Payoff or reward-to-risk | The size of average wins relative to average losses changes how much recovery potential exists after losses. |
| Trade count | More trades create more opportunities for both favorable outcomes and damaging sequences. |
| Losing streaks | Losses that cluster together can create account stress even when average results look acceptable. |
| Ruin definition | A strict drawdown or capital boundary will usually be reached more easily than total account loss. |
The risk-reward ratio matters because payoff changes the survival math. A model with many small losses and occasional larger wins can behave very differently from a model with frequent small wins and rare large losses.
Loss rate also matters because risk of ruin is sensitive to streaks. A trader does not only need to know how often losses occur on average; the account must survive when several losses arrive close together.
Why Risk of Ruin Estimates Can Mislead
Risk of ruin numbers can create false confidence when the inputs are too clean. A calculator may produce a precise-looking result even though the real trading environment includes changing volatility, execution friction, slippage, fees, emotional decisions, and model decay.
Limitation: Risk of ruin is only as reliable as the model behind it. If win rate, payoff, trade count, capital boundary, or position size is wrong, the output can understate how fragile the account really is.
A precise-looking calculator result is not the same as decision-grade assumption quality. The number may look exact while the inputs remain uncertain, stale, or too optimistic.
Positive expectancy does not remove ruin risk. A trading model can be profitable on average but still fail if position size is too large relative to the account or if losses cluster before the statistical edge has enough time to appear.
Recalculation also matters. After a drawdown, the same nominal trade size may represent a larger percentage of remaining capital. If sizing is not adjusted, the account may become more fragile exactly when the trader feels pressure to recover.
A Short Example Scenario
Illustrative scenario: Two traders use the same model with the same assumed win rate and payoff. Both define ruin as crossing a 40% account drawdown. One trader reduces nominal risk as capital falls, while the other keeps the same nominal trade size after an early drawdown. If both then hit the same losing streak, the second account can reach the defined ruin boundary faster even though the strategy statistics are identical.
The example is not about finding a universal safe percentage. It shows why exposure size, recalculation, and capital buffer can change account survival even when the trading model appears unchanged.
Common Mistakes When Reading Risk of Ruin
| Mistake | Safer interpretation |
|---|---|
| Treating risk of ruin as a prediction | It is a model-based probability, not a guaranteed future account path. |
| Assuming ruin only means zero | Ruin can mean crossing a drawdown, margin, recovery, or operating-capital boundary. |
| Ignoring loss clustering | The same average loss rate can feel very different when losses arrive in a streak. |
| Trusting calculator output without checking inputs | The result depends on whether the win rate, payoff, position size, fees, and trade count reflect realistic conditions. |
| Forgetting to recalculate after drawdown | The same nominal position can become more aggressive after capital has already fallen. |
Related Risk Concepts
Risk of ruin connects several risk-management inputs, but it should not replace them. Risk per trade controls exposure size, risk-reward ratio describes payoff structure, loss rate describes how often losses occur, and drawdown describes the account decline itself.
Risk of ruin is the survival-risk layer that combines those inputs into one question: can the account withstand adverse sequences without crossing the defined capital boundary?
FAQ
What does risk of ruin mean in trading?
Risk of ruin in trading means the probability that losses push an account below the capital level needed to continue or realistically recover under the same trading plan.
Does risk of ruin always mean losing the whole account?
No. In trading risk management, ruin can mean crossing a drawdown, margin, operating-capital, or recovery boundary. It does not have to mean the account reaches zero.
Can a profitable trading strategy still have risk of ruin?
Yes. A strategy can have positive average results but still carry ruin risk if position size is too large, losses cluster early, or the account has too little capital buffer.
Why can risk of ruin calculators be misleading?
Risk of ruin calculators can be misleading when win rate, payoff, trade count, fees, slippage, position size, or drawdown assumptions do not match realistic trading conditions.