The percent of stocks above the 200-day moving average is a market breadth participation indicator. It measures what share of a selected stock universe is trading above each stock’s own 200-day moving average. The selected universe matters because an S&P 500 reading, NYSE reading, Nasdaq reading, or Dow reading can describe different participation conditions.
Definition: The percent of stocks above the 200-day moving average shows the percentage of constituents in a chosen market universe that are trading above their own long-term moving average.
The indicator is not the same as checking whether an index price is above its 200-day moving average. An index can remain near a high while fewer individual stocks stay above their own long-term averages. That gap can reveal narrowing participation beneath the surface of the headline index.
Key Points
- The indicator measures participation across a selected stock universe.
- The reading rises when more constituents trade above their own 200-day moving average.
- Threshold zones describe breadth conditions, not automatic trading decisions.
- Interpretation weakens when index composition, narrow leadership, or universe mismatch distorts the reading.
What the Percent of Stocks Above the 200-Day Moving Average Measures
This breadth indicator classifies how much of a market is participating in a long-term trend. A high reading means many constituents are above their own 200-day moving average. A low reading means fewer constituents are above that long-term reference line.
The main value is participation quality. Price-only index analysis can be dominated by a small number of large components, especially in cap-weighted indexes. A breadth percentage treats each constituent as part of the participation count, which can expose whether strength is broad or concentrated.
| Question | What the indicator answers | What it does not answer |
|---|---|---|
| Participation | How many stocks remain above their own 200-day average? | Whether the index itself is above or below its 200-day average. |
| Trend breadth | Whether long-term participation is broad, mixed, or weak. | Whether a short-term price move will continue. |
| Universe condition | How participation looks inside the selected market group. | Whether a different index or exchange has the same condition. |
How the Indicator Is Calculated
The calculation starts with a defined universe, such as S&P 500 stocks, Nasdaq stocks, NYSE stocks, or another tracked group. Each constituent is checked against its own 200-day moving average. The number of constituents trading above that average is divided by the total number of constituents in the universe, then expressed as a percentage.
In simple form: reading = stocks above their own 200-day moving average / total stocks in the selected universe x 100. The formula is simple, but the universe selection controls what the number actually describes.
| Step | Calculation role | Interpretation note |
|---|---|---|
| Choose the universe | Define the group of stocks being measured. | The universe controls the final reading. |
| Check each constituent | Compare every stock with its own 200-day moving average. | The index price is not the input for each stock’s trend status. |
| Count stocks above the average | Identify how many constituents are above their own 200-day average. | The count reflects participation, not price magnitude. |
| Convert to a percentage | Divide the count by the total universe and multiply by 100. | The result is a breadth percentage for that universe. |
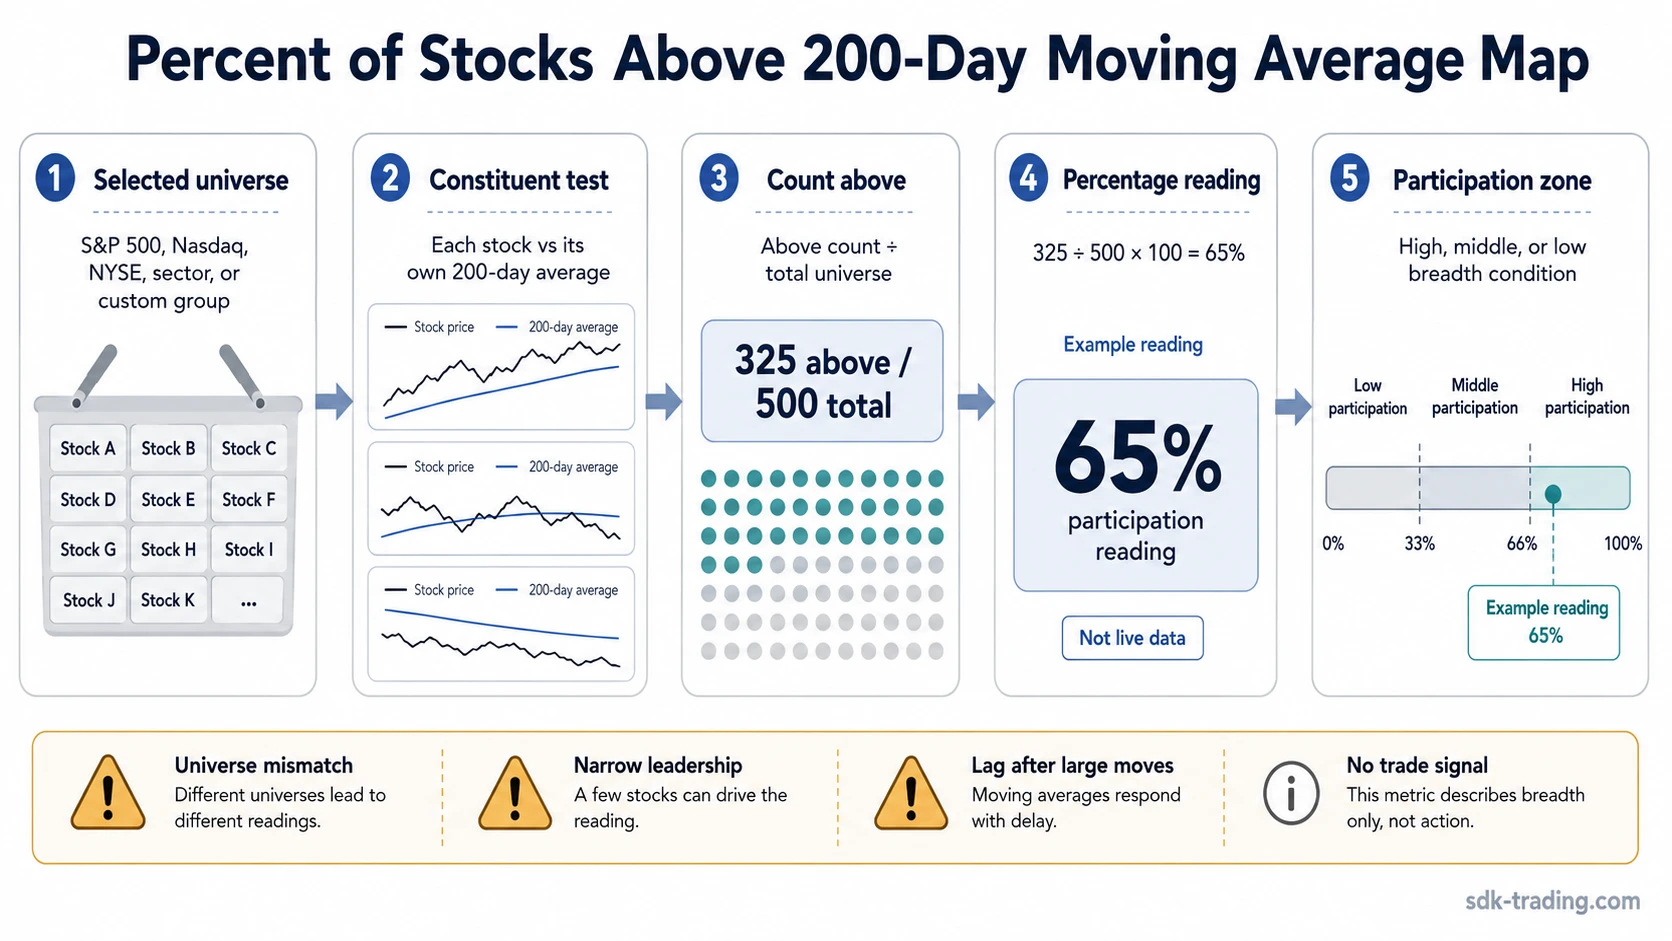
A reading of 65% means that 65% of the selected constituents are above their own 200-day moving average. It does not mean the index is 65% above its moving average. It also does not mean the same percentage applies to every other index universe.
How to Interpret High, Middle, and Low Readings
Thresholds are best treated as participation zones. They can help organize breadth conditions, but they should not be read as mechanical instructions. The same reading can mean different things depending on trend maturity, index composition, volatility, and whether other breadth measures agree.
| Reading zone | What it can suggest | What can mislead |
|---|---|---|
| High participation | Many constituents are above their own 200-day moving average. | A high reading can be mature if participation has already stayed elevated for a long period. |
| Middle participation | The market is mixed, with neither broad strength nor broad weakness dominating. | A middle reading can hide rotation if some groups improve while others deteriorate. |
| Low participation | Fewer constituents are holding above their long-term average. | A low reading does not automatically prove exhaustion, bottoming, or future recovery. |
Common references such as 30%, 50%, and 70% are rough participation zones: 50% is the midpoint, while lower and higher zones describe weaker or broader long-term participation.
What Strengthens or Weakens the Reading
The percentage carries more diagnostic value when it is treated as a bounded participation measure. It loses precision when it is treated as a complete market forecast.
| Diagnostic angle | Stronger interpretation | Weaker interpretation |
|---|---|---|
| What it measures | Constituent participation above a long-term trend reference. | Index direction, timing, or expected return. |
| Universe quality | The selected universe matches the market being analyzed. | The reading is applied to a different market than the one being discussed. |
| Trend alignment | The percentage expands while price structure also improves. | The index rises mainly because a few large components dominate the move. |
| Confirmation from other breadth measures | Other participation measures support the same broad message. | Other breadth measures disagree or show narrowing participation. |
| Timing context | The reading changes near a meaningful change in participation. | The reading lags after a large move has already occurred. |
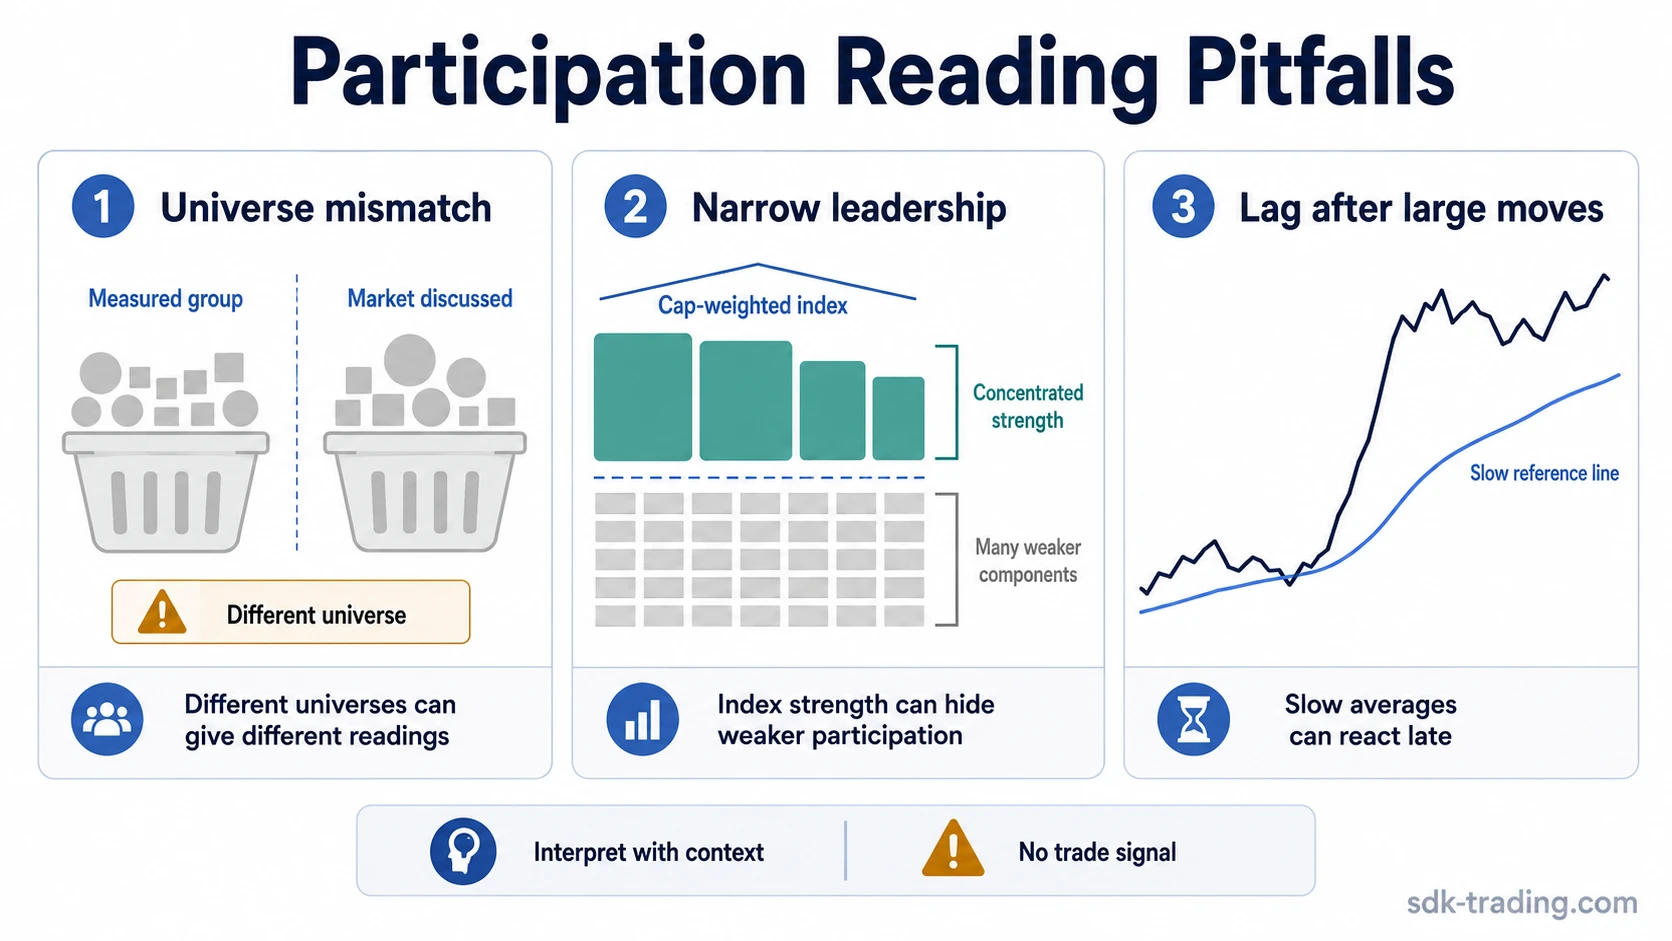
When the Indicator Can Mislead
The most common mistake is reading the percentage as a direct forecast. A broad participation reading can support interpretation, but it does not remove uncertainty. It can also lag because a 200-day moving average responds slowly to price movement.
Limitation: A strong index level and a weakening participation percentage can exist at the same time. That combination can happen when leadership narrows into a smaller number of large-weighted stocks while more constituents fall below their own long-term averages.
Universe mismatch is another frequent problem. A trader looking at the Nasdaq should not assume that an NYSE breadth reading describes the same participation structure. A sector-heavy or cap-weighted index can also create a different message from a broader exchange-level measure.
Mature high readings need caution as well. Broad participation is often constructive, but a long-lasting elevated reading may describe a crowded or advanced condition rather than a fresh improvement. The quality of the interpretation depends on sequence, not only the level.
Percent of Stocks Above 200-Day Moving Average vs Bullish Percent Index
The percent of stocks above the 200-day moving average is based on whether constituents are above a long-term moving average. The bullish percent index uses a different methodology based on point-and-figure bullish status across constituents. Both are breadth measures, but they do not answer the same question.
| Measure | Main input | What it mainly answers |
|---|---|---|
| Percent of stocks above 200-day moving average | Constituents above their own 200-day moving average. | Long-term trend participation across a selected universe. |
| Bullish percent index | Point-and-figure bullish status across constituents. | Breadth classification using a different point-and-figure condition. |
The useful distinction is methodological. One measure asks how many stocks are above a long-term trend line. The other asks how many stocks meet a point-and-figure bullish condition.
Example of a Basic Breadth Reading
A broad index remains close to its recent highs, but the percentage of constituents above their own 200-day moving average falls from a high zone toward the middle of its range. The index level still looks firm, yet participation is no longer as broad as it was earlier.
That condition does not automatically forecast a decline. It shows that fewer stocks are carrying the long-term participation structure. The reading gains weight if the same narrowing appears in related breadth measures, sector participation weakens, or recoveries become concentrated in a small group of large components.
The evidence remains less convincing if the universe is too narrow, the decline is brief, or other participation measures still show broad support. The diagnostic question is whether participation is genuinely narrowing or merely rotating between groups.
How to Read the Indicator Without Overreading It
A disciplined reading starts with the measured universe, the current zone, and the direction of change. A rising percentage means participation is expanding inside that universe; a falling percentage means fewer constituents are holding above their own long-term average.
The indicator has more value when it agrees with price structure and other breadth measures. It has less value when a cap-weighted index is being carried by a few large stocks, when the universe does not match the market being analyzed, or when short-term volatility is moving faster than the 200-day average can adjust.
FAQ
What does the percent of stocks above the 200-day moving average show?
It shows what percentage of a selected stock universe is trading above each stock’s own 200-day moving average. The reading describes long-term participation breadth.
Is a high reading always bullish?
No. A high reading can show broad participation, but it can also be mature if participation has already stayed elevated for a long period. Context and sequence matter.
Why can different indexes show different readings?
Each reading depends on the selected universe. S&P 500, Nasdaq, NYSE, Dow, sector, and custom-universe readings can differ because their constituent lists are different.
Does the indicator use the index 200-day moving average?
No. The calculation checks each constituent against its own 200-day moving average, then converts the count into a percentage for the selected universe.