The McClellan Summation Index is a cumulative market breadth indicator derived from the McClellan Oscillator. It adds oscillator values over time to show whether advancing and declining issues are building broader positive or negative breadth pressure.
Definition: The McClellan Summation Index measures accumulated breadth pressure by taking the running total of McClellan Oscillator readings, which are based on smoothed advance-decline market data.
A rising reading means the cumulative breadth input is improving. A falling reading means the cumulative breadth input is deteriorating. The interpretation is weaker when the index level rises while participation quality, index behavior, or recent oscillator movement does not support the cumulative move.
Key Points
- The McClellan Summation Index is a cumulative breadth indicator, not a price indicator.
- It is derived from smoothed advance-decline breadth and accumulates that input over time.
- Positive and negative readings describe accumulated breadth pressure rather than automatic market timing.
- Extreme readings can mislead when participation does not broaden or the oscillator input turns unstable.
What the McClellan Summation Index Measures
The McClellan Summation Index measures the cumulative direction of market breadth. Its raw input comes from the relationship between advancing issues and declining issues, usually on a broad exchange or index universe.
The useful distinction is cumulative pressure. A single breadth reading can change quickly, but the Summation Index shows whether those changes have been building over time. That makes it slower than the oscillator input and more useful for judging whether breadth is broadly expanding, contracting, or failing to confirm price behavior.
The indicator does not measure price trend by itself. A market index can rise while the Summation Index weakens if fewer stocks are participating. A market index can also look weak while the Summation Index begins stabilizing if breadth pressure stops deteriorating beneath the surface.
How the McClellan Summation Index Is Calculated
The calculation starts with advance-decline breadth. Advancing issues are compared with declining issues, that breadth input is smoothed into the McClellan Oscillator, and the Summation Index accumulates those oscillator readings as a running total.
| Step | Input or process | What it adds to the reading |
|---|---|---|
| 1. Breadth input | Advancing issues minus declining issues | Shows the daily balance between participation and deterioration |
| 2. Oscillator smoothing | Fast and slow smoothing of advance-decline breadth | Turns raw breadth into a more stable short-term breadth oscillator |
| 3. Cumulative summation | Running total of McClellan Oscillator values | Shows whether breadth pressure is accumulating positively or negatively |
| 4. Interpretation | Index level, direction, and behavior around reference zones | Helps judge whether broad participation is improving, weakening, or stretched |
A simplified calculation path is:
Calculation path: advancing issues minus declining issues -> smoothed McClellan Oscillator value -> cumulative running total -> Summation Index reading.
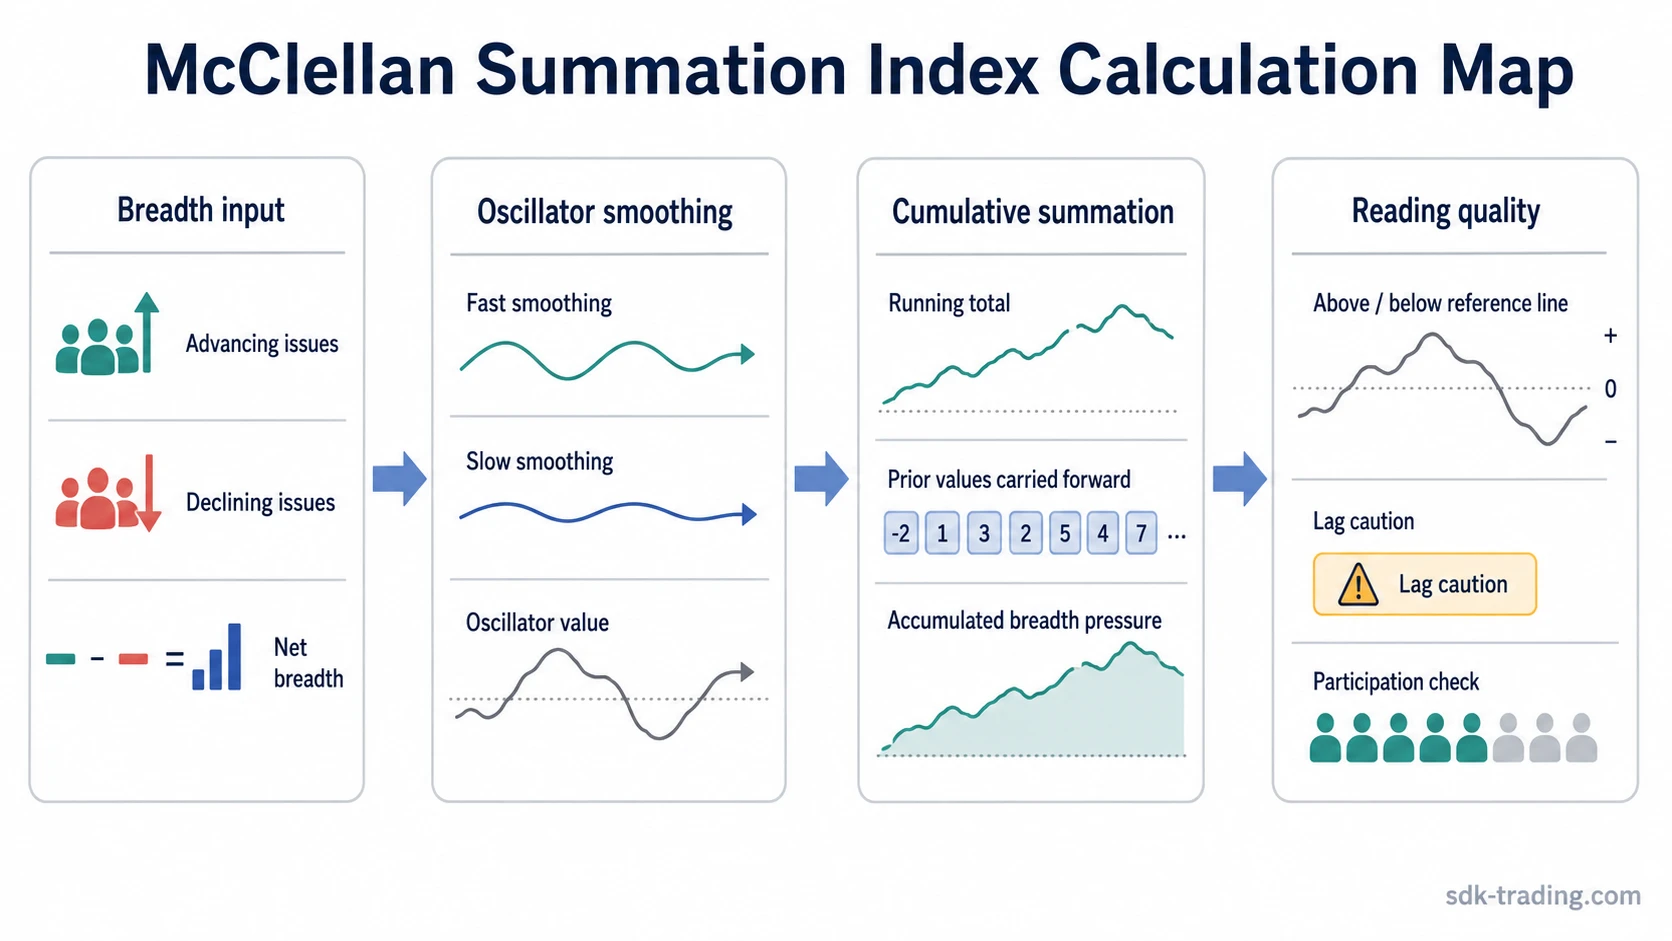
Charting platforms may label exchange-specific Summation Index versions differently. The useful reading still depends on the same breadth relationship: smoothed advance-decline behavior accumulated over time.
McClellan Summation Index vs McClellan Oscillator
The McClellan Oscillator is the faster input. The McClellan Summation Index is the cumulative version of that input. The oscillator can turn quickly when short-term breadth improves or weakens, while the Summation Index usually moves more slowly because it carries the effect of prior oscillator values.
| Indicator | Main focus | Typical interpretation risk |
|---|---|---|
| McClellan Oscillator | Shorter-term smoothed breadth movement | Can swing quickly and overstate short-term shifts |
| McClellan Summation Index | Cumulative oscillator-derived breadth pressure | Can lag because it accumulates prior oscillator values |
The practical difference is sequence. The oscillator often changes first. The Summation Index then shows whether those oscillator readings are accumulating into a broader participation shift or fading before the cumulative reading becomes more meaningful.
How to Read Positive, Negative, and Extreme Readings
A positive reading generally means accumulated breadth pressure is above the reference line. A negative reading generally means accumulated breadth pressure is below it. The zero line can help separate positive and negative breadth regimes, but it should not be treated as a mechanical decision point.
Rising readings usually suggest breadth improvement. Falling readings usually suggest breadth deterioration. Extreme readings can show that breadth pressure is stretched, but the same extreme can mean different things depending on whether price, participation, and the recent oscillator input confirm or conflict with the index level.
| Reading behavior | Safer interpretation | Common overread |
|---|---|---|
| Rising above the zero line | Accumulated breadth pressure is improving | Treating the crossover as automatic timing confirmation |
| Falling below the zero line | Accumulated breadth pressure is weakening | Assuming price must immediately follow breadth lower |
| Very high reading | Broad participation may be extended or strong | Calling every high reading exhaustion |
| Very low reading | Breadth deterioration may be stretched or deeply negative | Calling every low reading a durable reversal condition |
Thresholds are best treated as reference zones. Their meaning depends on the market universe, the data source, the calculation version, and whether the latest oscillator movement supports the accumulated reading.
Clean, Weak, and Misleading Readings
The strongest use of the McClellan Summation Index is not the number alone. The reading gains quality when the cumulative direction, recent oscillator behavior, and visible participation all point in the same direction.
| Reading type | What it measures | What it does not confirm | What strengthens it | What weakens or invalidates it |
|---|---|---|---|---|
| Clean improvement | Accumulated breadth pressure is rising | Exact timing or price follow-through | Recent oscillator readings remain positive and participation broadens | Price fails to respond while oscillator momentum fades |
| Weak improvement | The cumulative line is rising, but support is narrow | Durable market strength | More groups participate and breadth gains become less concentrated | A few large stocks lift the index while broad participation stays thin |
| Clean deterioration | Accumulated breadth pressure is falling | Immediate downside continuation | Recent oscillator readings remain negative and more stocks decline | Oscillator readings stabilize while price stops accepting lower levels |
| Misleading extreme | The cumulative reading has moved far from its reference area | Exhaustion, reversal, or continuation by itself | Price behavior and participation confirm the stretched condition | The reading stays extreme while market behavior absorbs it without follow-through |
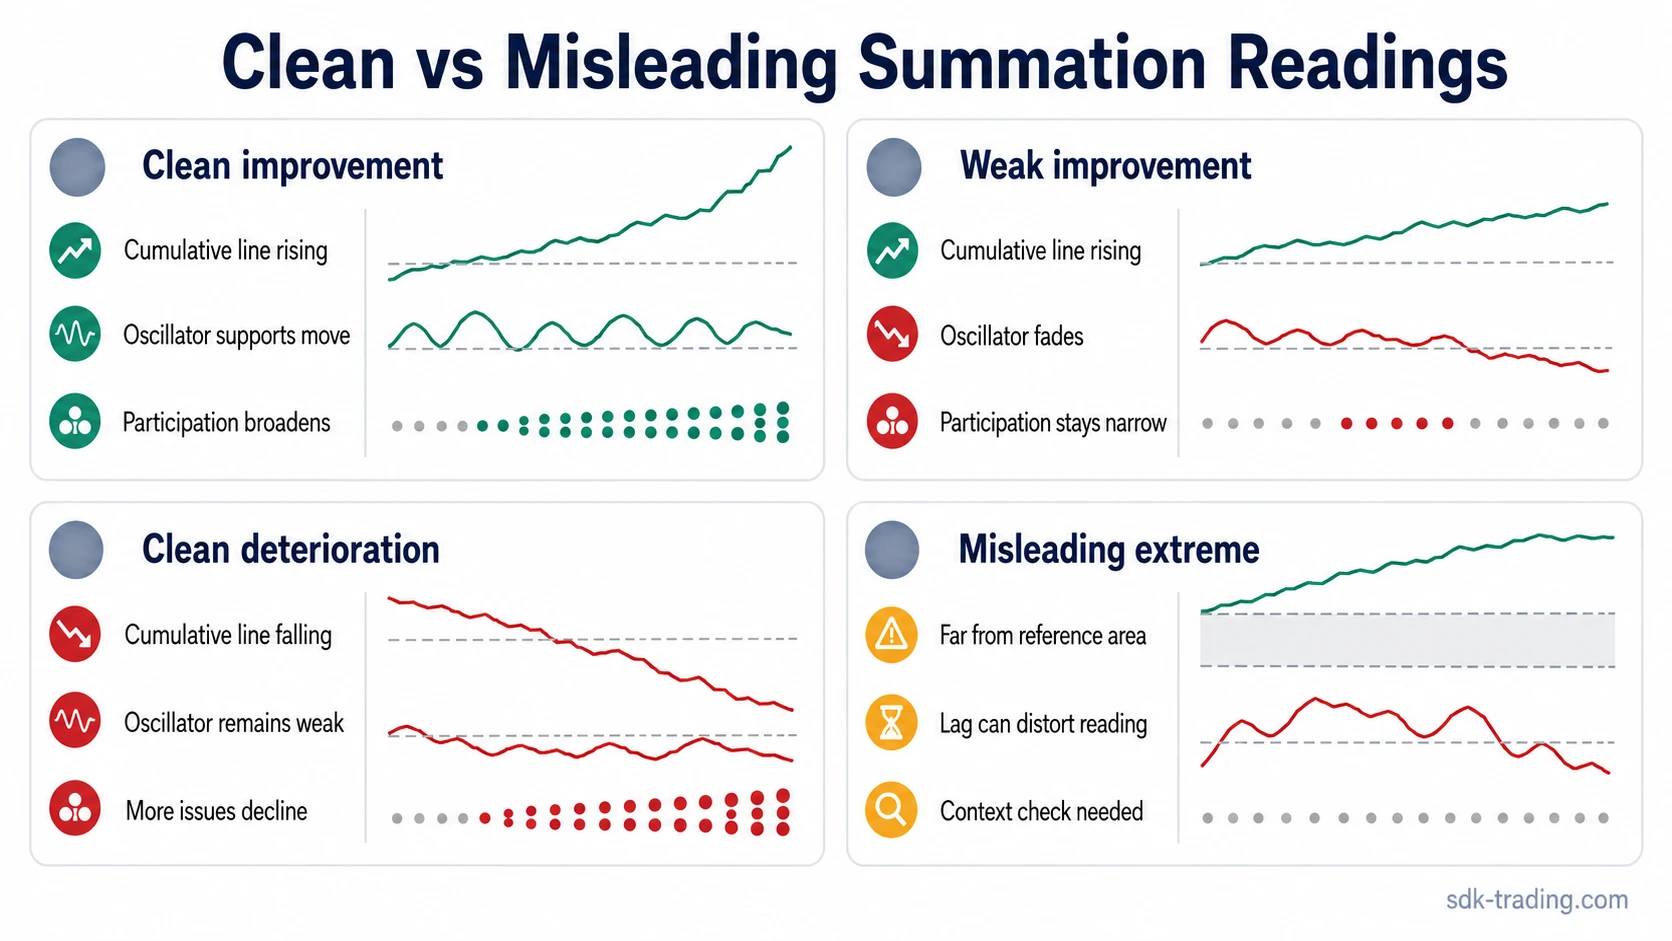
Lag is the main structural limitation. Because the Summation Index accumulates previous oscillator values, it can keep rising or falling after shorter-term breadth has already started to change. That lag can be useful for trend-level breadth context, but it can also delay recognition of a fresh shift.
Neighbor Breadth Indicators
The McClellan Summation Index belongs to the breadth indicator family, but its input and reading logic are specific. It should not be blended with other participation indicators without separating what each one actually measures.
| Indicator | Main input | How it differs from the McClellan Summation Index |
|---|---|---|
| McClellan Summation Index | Cumulative McClellan Oscillator values | Measures accumulated oscillator-derived breadth pressure |
| High-Low Index | New 52-week highs and new 52-week lows | 52-week high and low participation is normalized into a breadth percentage rather than accumulated from oscillator values |
| Bullish Percent Index | Percentage of stocks in bullish point-and-figure status | Breadth participation through bullish chart status is different from smoothed advance-decline accumulation |
| Advance-Decline Line | Net advancing issues minus declining issues | Accumulates net advances directly, without the McClellan Oscillator smoothing layer |
The separation matters because two indicators can rise at the same time for different reasons. One may reflect broad short-term participation, another may reflect new high expansion, and another may reflect cumulative oscillator pressure.
Practical False-Reading Scenario
A market index advances while the McClellan Summation Index also rises, but most of the price gain comes from a narrow group of large components. The reading is tempting because cumulative breadth has improved, yet the interpretation remains incomplete if new participation does not spread beyond the leading group.
The reading becomes more defensible when recent oscillator values stay positive and more stocks join the advance. It remains suspect when the oscillator rolls over, the cumulative line is still rising from earlier values, and the index continues to depend on narrow leadership.
The diagnostic point is cumulative breadth quality. A rising Summation Index is more convincing when the market also shows broader participation, not only a delayed effect from earlier oscillator strength.
FAQ
What does the McClellan Summation Index measure?
The McClellan Summation Index measures accumulated market breadth pressure by adding McClellan Oscillator values over time.
How is the McClellan Summation Index different from the McClellan Oscillator?
The McClellan Oscillator is the faster smoothed breadth input, while the McClellan Summation Index is the cumulative running total of that oscillator input.
Can the McClellan Summation Index give false readings?
Yes. A reading can mislead when the cumulative line rises or falls but participation quality, price behavior, or recent oscillator movement does not support the move.