The McClellan Oscillator is a market-breadth momentum indicator that uses advancing and declining issues to measure participation beneath an index move. It smooths net advances with short and long exponential moving averages, then plots the difference between them as an oscillator.
Definition: The McClellan Oscillator compares short-term and longer-term smoothed advance-decline momentum. A rising value can indicate improving breadth participation, while a falling value can indicate weakening participation pressure.
The important boundary is that the McClellan Oscillator is not raw advance-decline data. Raw breadth counts show the daily input. The oscillator converts that input into a smoothed momentum measure, which makes short-term breadth shifts easier to compare across sessions.
Key Points
- The McClellan Oscillator is built from advancing issues minus declining issues.
- The common calculation compares a faster smoothed breadth line with a slower smoothed breadth line.
- Positive and negative values describe breadth behavior around the zero line, not automatic trade actions.
- Extreme values can reflect stretched participation pressure, but they do not predict reversal by themselves.
- The McClellan Summation Index uses the oscillator cumulatively, so it answers a different breadth question.
What Is the McClellan Oscillator?
The McClellan Oscillator is a technical-analysis indicator used to read breadth momentum across a market universe such as an exchange, index group, or defined list of securities. Instead of looking only at the price index, it asks whether more components are advancing or declining beneath the surface.
A positive value generally means the faster smoothed advance-decline measure is above the slower measure. A negative value generally means the faster measure is below the slower measure. The zero line becomes the reference point for whether smoothed breadth behavior is leaning positive or negative.
The oscillator is most useful when it is interpreted as participation evidence. Index price can rise while participation narrows, or price can stall while breadth starts improving. That gap between price behavior and underlying participation is the main reason breadth indicators exist.
Breadth momentum is more useful when it is read inside a broader risk-on risk-off context, because participation can weaken or improve for reasons that also involve credit, liquidity, yields, volatility, and risk appetite.
How the McClellan Oscillator Is Calculated
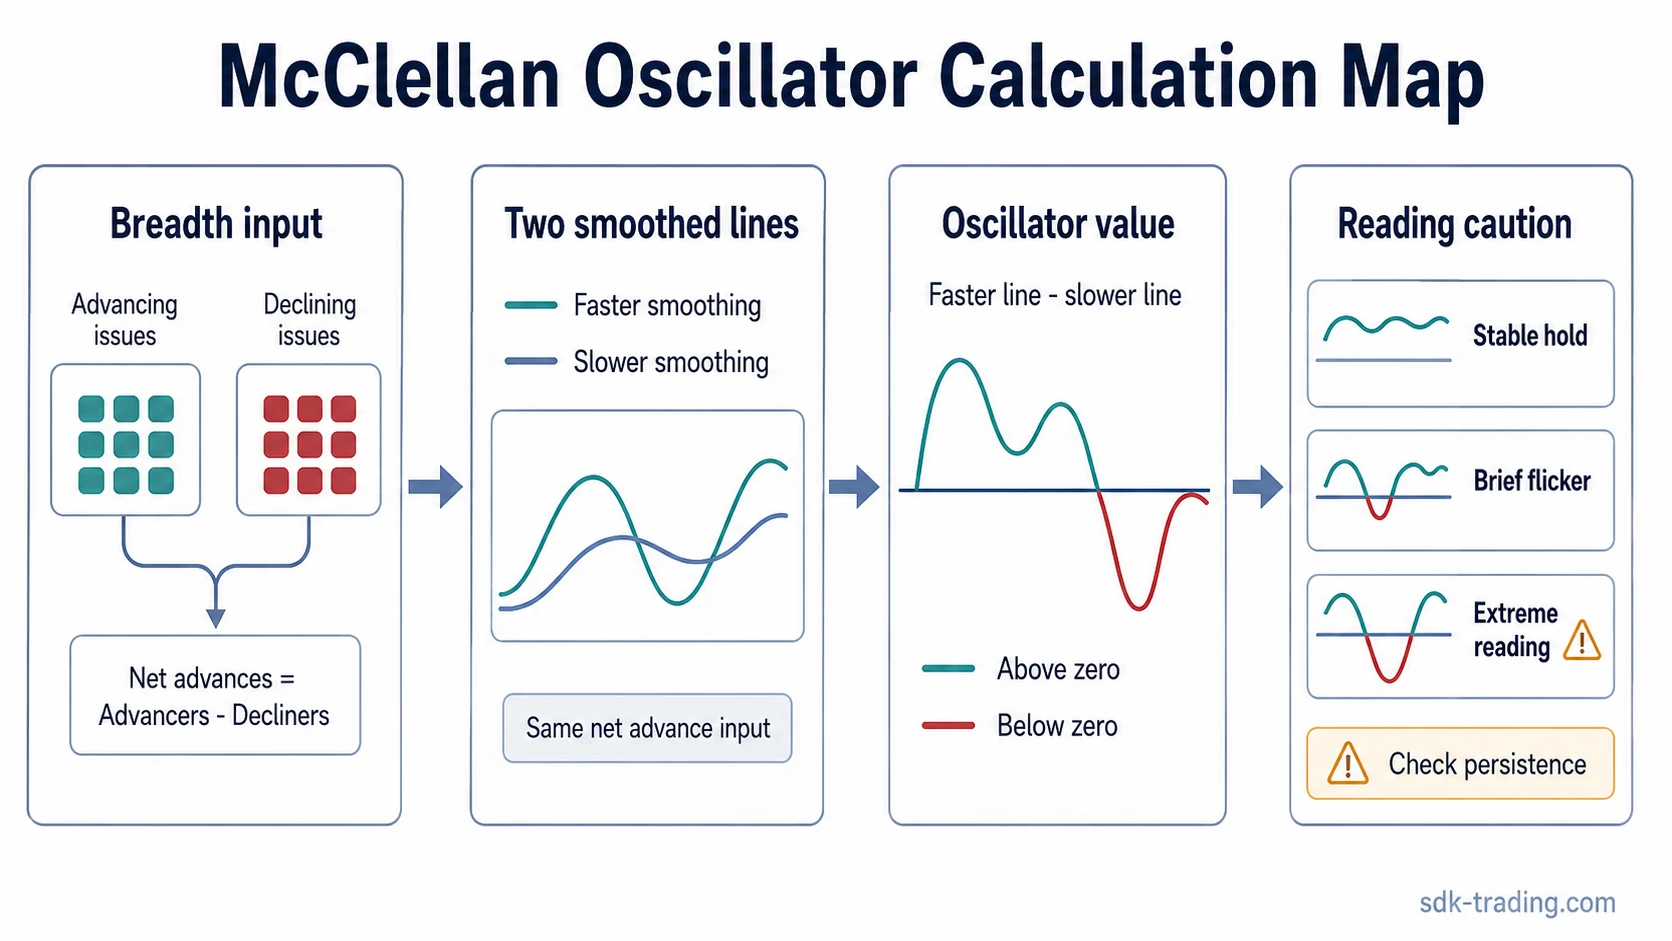
The calculation starts with net advances. Net advances are the number of advancing issues minus the number of declining issues in the selected market universe.
The standard form then smooths that net advance-decline series with a faster exponential moving average and a slower exponential moving average. The McClellan Oscillator is the difference between those two smoothed values. Traditional McClellan calculations are commonly described with 10% and 5% smoothing constants, often approximated as 19-period and 39-period EMA-style smoothing of net advances.
| Calculation part | What it uses | What it contributes |
|---|---|---|
| Advancing issues | Securities closing higher in the selected universe | Positive participation input |
| Declining issues | Securities closing lower in the selected universe | Negative participation input |
| Net advances | Advancing issues minus declining issues | Raw breadth pressure for the session |
| Faster smoothing | Shorter EMA of net advances | More responsive breadth behavior |
| Slower smoothing | Longer EMA of net advances | Slower breadth baseline |
| Oscillator value | Faster smoothed breadth minus slower smoothed breadth | Momentum measure around the zero line |
Some data providers also publish ratio-adjusted versions. These normalize the advance-decline input against the size of the selected universe before smoothing, which can reduce distortions when the number of listed issues changes over time.
How to Read McClellan Oscillator Values
The zero line is the first reference point. A move above zero can indicate that short-term breadth pressure has turned stronger than the slower breadth baseline. A move below zero can indicate that short-term participation has weakened relative to that baseline.
Extreme positive or negative values need more care. A very high value can reflect strong upside participation, but it can also mean breadth pressure is stretched after a fast move. A very low value can reflect broad downside pressure, but it does not automatically mean selling pressure has ended.
| Reading area | Possible breadth interpretation | Common overread |
|---|---|---|
| Above zero | Short-term breadth behavior is positive relative to the slower baseline. | Treating every positive value as a bullish market call. |
| Below zero | Short-term breadth behavior is negative relative to the slower baseline. | Treating every negative value as proof of further downside. |
| Near zero | Advance-decline pressure is balanced or unstable around the reference line. | Reacting to every small crossover without checking persistence. |
| High positive extreme | Upside participation pressure may be unusually strong or stretched. | Assuming the market must immediately reverse. |
| Low negative extreme | Downside participation pressure may be unusually broad or stretched. | Assuming the market has already formed a durable low. |
Divergence is another common use. If an index rises while the oscillator fails to hold above zero or makes weaker highs, participation may be narrower than the index move suggests. That condition does not forecast a reversal by itself. It only weakens the breadth evidence behind the price move.
Clean, Weak, and Misread McClellan Oscillator Readings
A McClellan Oscillator value becomes more useful when behavior around the number is separated from the number itself. A single crossover or extreme print is less informative than persistence, follow-through, and agreement with broader participation.
| Reading quality | Typical behavior | Safer interpretation |
|---|---|---|
| Clean reading | The oscillator moves through zero and holds on the same side while participation broadens across the selected universe. | Breadth improvement is more defensible because the move is not only a one-session flicker. |
| Weak reading | The oscillator crosses zero briefly, then quickly returns to the prior side without broader participation support. | The move is unstable and may reflect noise rather than a durable breadth shift. |
| Misread case | The index advances, but the oscillator cannot stay positive because gains are concentrated in a narrow group of large components. | Price strength may be less broad than it appears from the index alone. |
A practical scenario is an index making a higher high while the McClellan Oscillator briefly moves above zero, then fails to hold there. The index move may still continue, but breadth support is less convincing when participation fails to expand beyond narrow leadership.
McClellan Oscillator vs McClellan Summation Index
The McClellan Oscillator and the McClellan Summation Index use the same breadth family, but they answer different questions. The oscillator focuses on smoothed breadth behavior around the zero line. The Summation Index accumulates oscillator values to describe the broader cumulative breadth trend.
That distinction changes interpretation. The oscillator can react more quickly to shifts in advance-decline pressure. The cumulative version is slower and better suited to judging whether repeated oscillator behavior is building or eroding broader breadth structure.
| Measure | Main question | Typical reading style |
|---|---|---|
| McClellan Oscillator | Is short-term breadth momentum improving or weakening? | Zero-line shifts, extremes, short-term participation behavior |
| McClellan Summation Index | Is cumulative breadth pressure building or deteriorating? | Longer cumulative breadth direction and persistence |
How It Differs From Other Breadth Indicators
The McClellan Oscillator belongs to the breadth-indicator family, but it should not be blended with every other participation measure. Different breadth tools use different inputs and answer different questions.
| Related breadth concept | Main input | How it differs from the McClellan Oscillator |
|---|---|---|
| Advance Decline Line | Cumulative net advances | Tracks a running breadth total rather than a smoothed momentum spread. |
| New Highs New Lows | Issues making 52-week highs and lows | Focuses on participation at long-term extremes rather than daily advancing and declining issues. |
| High-Low Index | New highs as a percentage of new highs plus new lows | Normalizes high-low participation into a percentage breadth reading. |
| Put Call Ratio | Options put volume versus call volume | Measures options sentiment rather than stock participation breadth. |
| TRIN | Advance-decline counts and volume pressure | Combines breadth and volume pressure instead of smoothing net advances into an oscillator. |
The cleaner distinction starts with the input each indicator uses. If the input is daily advances and declines, the McClellan Oscillator may be relevant. If the input is cumulative breadth, 52-week extremes, options activity, or volume-weighted pressure, a different breadth or sentiment tool is doing the work.
Limitations of the McClellan Oscillator
Smoothing lag: EMA smoothing reduces raw noise, but it also means the oscillator can respond after the earliest participation shift has already started.
Zero-line flickers: Small crosses around zero can occur during choppy breadth conditions. Persistence usually matters more than the first crossover.
Universe dependency: A value depends on the selected exchange, index group, or data universe. Different universes can produce different breadth messages.
Narrow leadership: Index strength can look firm while smoothed breadth remains weak if gains are concentrated in a small group of large components.
Data revisions: Breadth data can vary by provider and timing, so final values can differ from intraday impressions.
The McClellan Oscillator is strongest as a participation filter. It can help separate broad participation from narrow index movement, but the interpretation remains conditional on the market universe, data quality, smoothing method, and surrounding breadth evidence.
FAQ
What is the McClellan Oscillator?
The McClellan Oscillator is a market-breadth momentum indicator based on advancing and declining issues. It compares faster and slower smoothed advance-decline measures to read participation pressure around a zero line.
How is the McClellan Oscillator calculated?
It starts with net advances, which are advancing issues minus declining issues. A faster smoothed version is compared with a slower smoothed version, and the difference becomes the oscillator value.
What does a positive or negative McClellan Oscillator reading mean?
A positive reading generally means short-term breadth momentum is stronger than the slower breadth baseline. A negative reading generally means short-term breadth momentum is weaker than that baseline.
How is the McClellan Oscillator different from the McClellan Summation Index?
The McClellan Oscillator reads shorter-term smoothed breadth momentum. The McClellan Summation Index accumulates oscillator values to describe broader cumulative breadth behavior.
Can the McClellan Oscillator be used for individual stocks?
The McClellan Oscillator is designed for a group of securities, such as an exchange or index universe. It is not an individual-stock indicator because it depends on advancing and declining issue counts.