The put call ratio measures put option activity relative to call option activity in a chosen options market. It is usually read as an options-derived sentiment or participation measure, but the result depends on the dataset, ratio construction, and market context.
Definition: The put call ratio compares the number of puts with the number of calls over a selected period or dataset. A higher ratio means put activity is larger relative to call activity, while a lower ratio means call activity is larger relative to put activity.
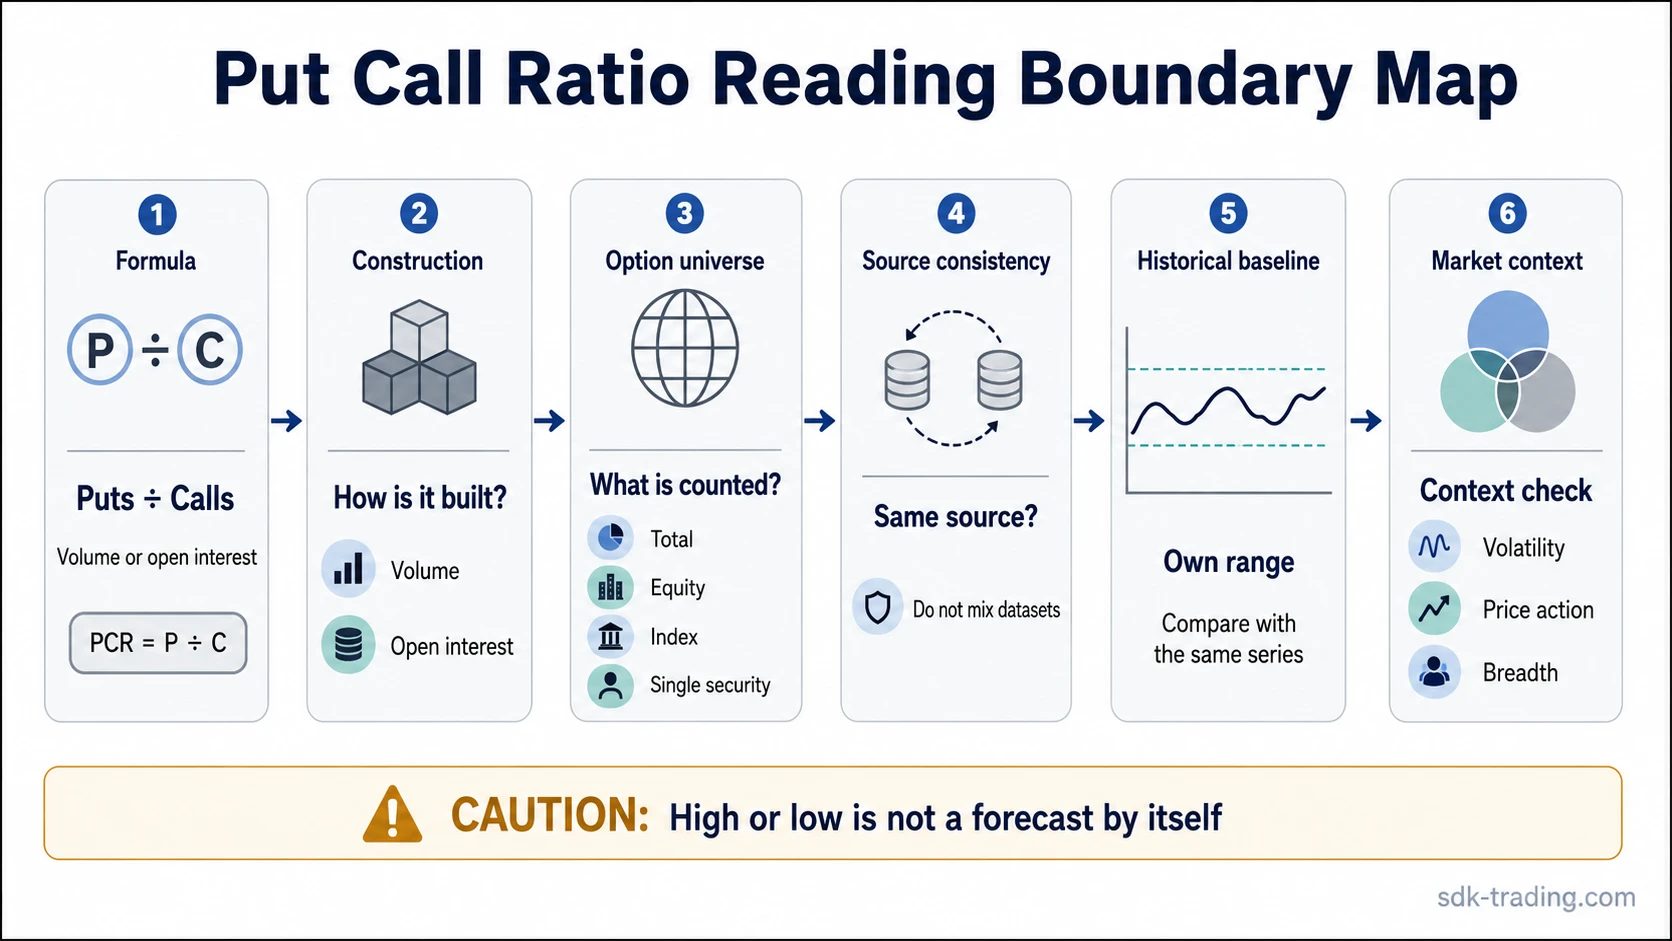
In its common volume-based form, the ratio is calculated as put option volume divided by call option volume.
The number does not reveal trader motive by itself. Put buying can reflect fear, protection, volatility demand, portfolio hedging, or speculation. Call buying can reflect directional appetite, hedging activity, or options positioning around an event. The ratio is most useful as a context clue rather than a standalone forecast or timing tool.
What Is the Put Call Ratio?
The put call ratio is an options-market indicator that compares demand for put options with demand for call options. Put options are commonly associated with downside protection or bearish positioning, while call options are commonly associated with upside participation or bullish positioning. That association is only a starting point.
When the focus shifts from aggregate put demand to the mechanics of buying downside exposure, the contract itself is better understood through a long put option framework.
A high put call ratio can show heavier put activity, but it does not by itself mean the market must fall or reverse. A low put call ratio can show heavier call activity, but it cannot confirm strength or complacency alone. The interpretation becomes more meaningful when the same source, same option universe, same calculation method, and relevant market background are compared consistently.
How the Put Call Ratio Is Calculated
The most common put call ratio formula is simple:
Formula: Put Call Ratio = Put Option Volume / Call Option Volume
If a market records 900,000 put contracts and 600,000 call contracts during the same measurement period, the volume-based put call ratio is 1.50. Put volume was one and a half times call volume in that dataset.
The same idea can also be built from open interest instead of volume. Volume measures contracts traded during a period. Open interest measures contracts that remain open. A volume-based ratio can respond quickly to new activity, while an open-interest-based ratio may describe the positioning that remains after trading has occurred.
| Construction | What it compares | Main interpretation boundary |
|---|---|---|
| Volume-based put call ratio | Put volume divided by call volume | Shows current-period options activity, not the motive behind each trade. |
| Open-interest-based put call ratio | Put open interest divided by call open interest | Shows open positioning, not necessarily fresh demand during the current session. |
Put Call Ratio Types
The put call ratio changes meaning when the option universe changes. A total market ratio, an equity-only ratio, an index ratio, and a single-security ratio can all move differently because they are built from different option activity.
| Ratio type | What it includes | What it can show | What it does not show |
|---|---|---|---|
| Total put call ratio | Broad put and call activity across a wider options dataset | General balance between put and call activity in the selected source | Whether the activity came from hedging, speculation, or market-making flows |
| Equity put call ratio | Options on individual stocks | Relative put and call activity in single-stock options | Index-level hedging demand or broader portfolio-protection activity |
| Index put call ratio | Options on indexes | Index-level protection, hedging, or positioning pressure | Participation across individual stocks inside the index |
| Single-security put call ratio | Options tied to one stock, ETF, or instrument | Options activity around that instrument | Broad market sentiment unless the instrument itself is a strong market proxy |
| Open-interest put call ratio | Open put contracts relative to open call contracts | Remaining options positioning in the selected dataset | Fresh trading pressure during the current period |
How High and Low Put Call Ratio Readings Are Interpreted
A high number means put activity is high relative to call activity in the selected dataset. A low number means call activity is high relative to put activity. Interpretation remains incomplete until the ratio is compared with its own history, source, construction, and surrounding market conditions.
| Reading | Possible interpretation | Required checks | Failure condition |
|---|---|---|---|
| High put call ratio | Heavier put activity may reflect defensive demand, fear, volatility demand, or downside positioning. | Check the same source’s historical range, index versus equity scope, expiration effects, volatility, and price context. | The interpretation weakens if put demand is mainly event hedging, expiration-related activity, or a source-specific outlier. |
| Low put call ratio | Heavier call activity may reflect upside appetite, speculative demand, or reduced demand for put protection. | Check whether call activity is broad, concentrated, source-consistent, and aligned with broader participation. | The interpretation weakens if call demand is narrow, event-driven, or caused by a temporary options-flow imbalance. |
| Near historical norm | Options activity may be balanced relative to its own baseline. | Compare with the same construction over time rather than a universal threshold. | The number adds little if the baseline is unstable or the dataset has changed. |
Thresholds can be useful as reference points only when they come from the same dataset and construction. A level that looks extreme for one equity-only ratio may be normal for another index-based or total-market ratio.
Why Fixed Put Call Ratio Thresholds Can Mislead
Fixed thresholds create the biggest interpretation risk. A put call ratio above a selected level is not automatically bearish or bullish, and a ratio below a selected level is not automatically constructive or dangerous. The same value can carry different meaning across datasets.
Limitation: A put call ratio should be compared against its own historical baseline. Changing from total options to equity-only options, from volume to open interest, or from one data provider to another can make the comparison unreliable.
Before comparing values across websites, check whether the provider uses total, equity, index, single-security, volume-based, or open-interest data.
Expiration cycles can also distort the result. Options activity often changes around monthly expiration, weekly expiration, earnings windows, macro events, volatility shocks, or portfolio hedging periods. A high put call ratio during an event window may show protection demand rather than a clean directional view.
A safer interpretation asks whether the ratio is unusual for the same source and whether other market evidence supports the conclusion. Without that baseline, the number may describe options activity accurately while still being easy to overread.
Diagnostic Boundary: What the Ratio Shows and Does Not Show
The put call ratio works best as a boundary tool. It can describe the balance of put and call activity, but it cannot identify motive, timing, or market direction on its own.
| Diagnostic question | What the put call ratio shows | What it does not show | Quality improves when | Quality weakens when |
|---|---|---|---|---|
| Options activity balance | Whether puts or calls are more active in the selected dataset | Why participants used those options | The same source and construction are tracked over time | The dataset changes or sources are mixed without adjustment |
| Sentiment pressure | Whether activity leans more toward puts or calls | Whether the lean comes from speculation, hedging, or protection | The ratio is checked with volatility, price action, and breadth context | The number is treated as a direct forecast |
| Extreme reading | Whether the ratio is high or low relative to its own history | Whether an extreme must reverse immediately | The extreme persists or appears with supporting context | The extreme comes from expiration or event-related flow |
| Market context | How options activity fits into a broader market read | Whether equities are broadly participating or narrowing internally | Options data is checked beside price, volatility, and participation measures | Options activity is isolated from broader market evidence |
Put Call Ratio vs Equity Breadth Measures
The put call ratio is built from options activity. Equity breadth measures are built from the behavior of stocks or issues inside a market universe. That distinction matters because options positioning can change even when stock participation is not changing in the same way.
Unlike the advance-decline ratio, which compares advancing and declining stocks, the put call ratio compares put and call option activity. One measures options-market positioning pressure; the other measures equity participation balance.
This separation helps prevent a category error. A high put call ratio may show heavier put activity, while equity breadth may show whether weakness is broad across stocks or concentrated in fewer names. The two measures can complement each other, but they are not interchangeable.
Common Mistakes When Reading the Put Call Ratio
| Mistake | Why it creates risk | Safer reading |
|---|---|---|
| Treating one value as a forecast | The ratio describes put activity relative to call activity, not the next market move. | Compare the number with its own baseline and broader market context. |
| Using universal thresholds | Different sources and ratio types can have different normal ranges. | Use thresholds only inside the same source, scope, and construction. |
| Ignoring hedging activity | Put demand may reflect protection rather than outright bearish conviction. | Check volatility, event timing, index hedging, and price behavior before assigning motive. |
| Mixing volume and open interest | Fresh trading activity and remaining open positioning are not the same measurement. | Label the construction clearly before comparing values. |
| Comparing different datasets | Total, equity, index, and single-security ratios can move for different reasons. | Keep the universe consistent or state exactly what changed. |
Simple Put Call Ratio Example in Context
A market shows a high put call ratio before a major scheduled event. Put volume rises sharply in short-dated options, and the first interpretation may be defensive sentiment. That interpretation remains incomplete until the source, option universe, expiration schedule, volatility backdrop, and price behavior are checked.
The interpretation becomes cleaner if the same ratio is unusually high versus its own history and broader market evidence also shows defensive behavior. It stays weaker if the increase is concentrated in short-dated event hedges or if the ratio returns to its normal range immediately after expiration. No trade setup is implied; the ratio only adds context to the broader market read.
FAQ
What does the put call ratio measure?
The put call ratio measures put option activity relative to call option activity in a selected options market. It can be based on volume or open interest, depending on the data source.
What is the put call ratio formula?
The common formula is put option volume divided by call option volume. Some versions use open interest instead of volume, so the construction should be checked before comparing readings.
Is a high or low put call ratio bullish or bearish?
A high put call ratio shows heavier put activity, while a low put call ratio shows heavier call activity. Neither reading is automatically bullish or bearish without historical baseline, source consistency, and market context.
Why do put call ratio readings differ across websites?
Readings can differ because sources may use different option universes, calculation methods, time periods, and volume or open-interest data. Total, equity, index, and single-security ratios are not always comparable.