The advance-decline ratio is a market breadth indicator that divides the number of advancing stocks by the number of declining stocks. It shows whether participation is leaning toward more rising or falling issues, but it does not show how far prices moved, how much volume supported the move, or whether the reading will persist.
Definition: The advance-decline ratio compares advancing issues with declining issues over a measured period, usually a trading session. A ratio above 1 means more issues advanced than declined, while a ratio below 1 means more issues declined than advanced.
Key Points
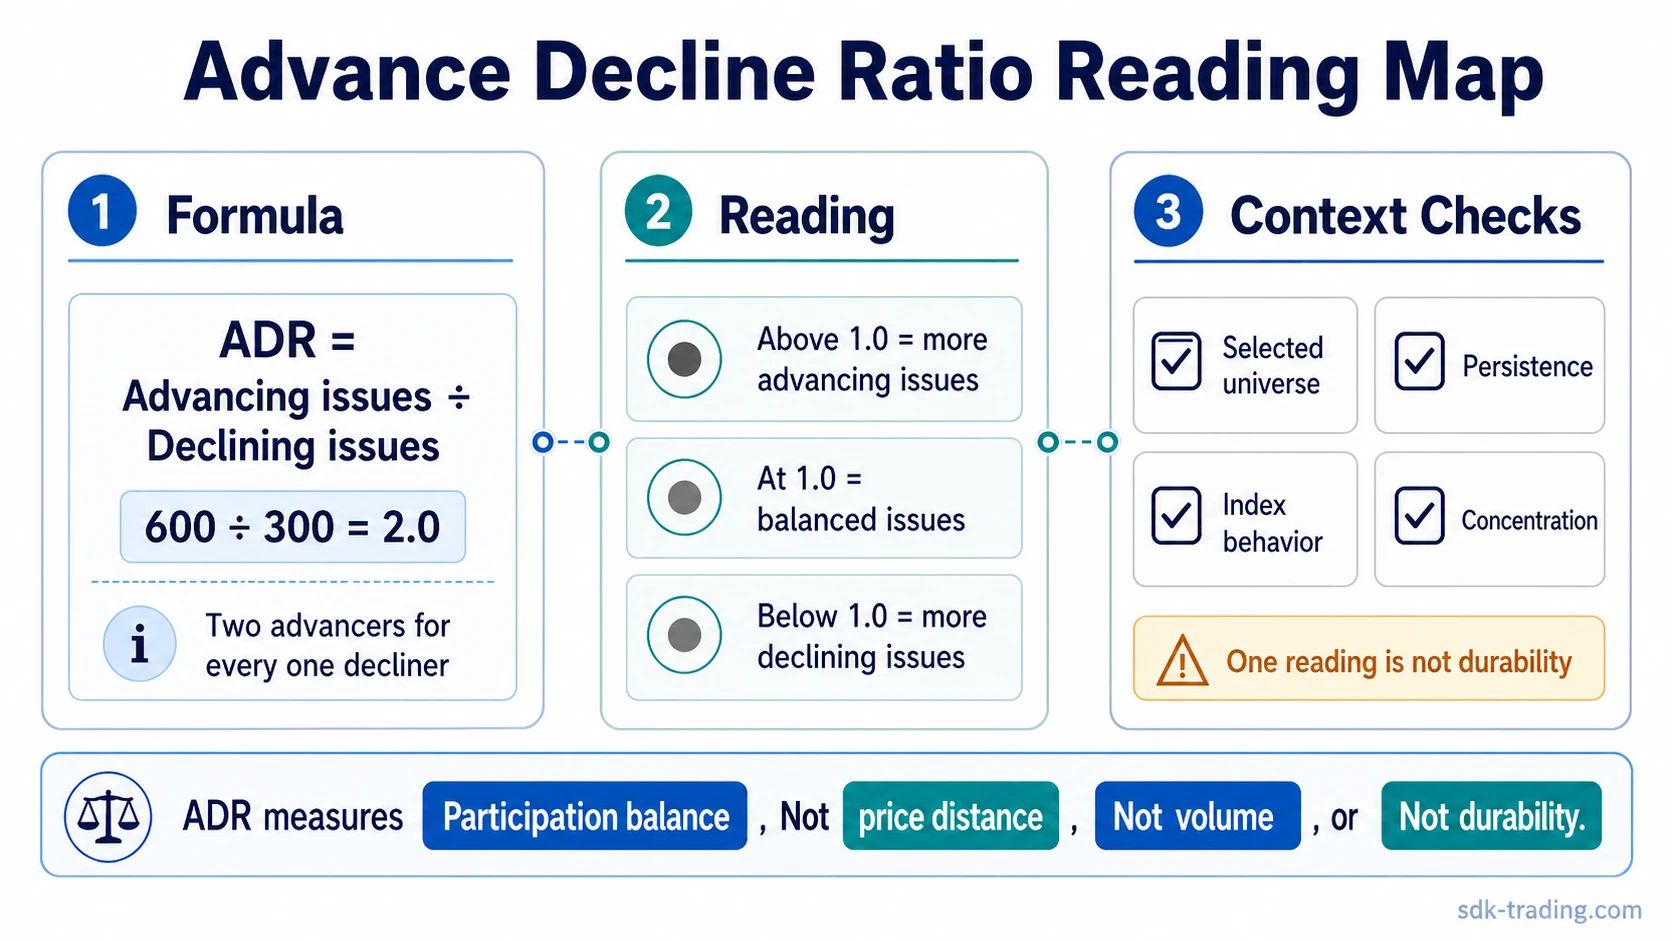
- The advance-decline ratio formula is advancing issues divided by declining issues.
- The ratio measures participation balance, not price magnitude, volume, or trend durability.
- A reading above 1 shows more advancing issues; a reading below 1 shows more declining issues.
- Single-session readings need the selected universe, persistence, index behavior, and concentration checked before interpretation.
Advance Decline Ratio: Definition and Formula
ADR belongs to the market breadth family because it compares the number of issues closing higher with the number closing lower inside a selected market universe.
Formula: Advance-decline ratio = advancing issues / declining issues.
A simple calculation makes the ratio easier to read. If 600 issues advance and 300 issues decline, the advance-decline ratio is 2.0. That means there were two advancing issues for every one declining issue in the measured universe.
If 300 issues advance and 600 issues decline, the ratio is 0.5. That means declining issues outnumbered advancing issues by two to one. The number describes participation balance only; it does not describe whether a trader should act.
Very high readings can also become less informative when the number of declining issues is unusually small, so the size and consistency of the measured universe still matter.
What the Advance Decline Ratio Measures
The advance-decline ratio measures participation across a chosen market group. That group may be an exchange, an index universe, a sector list, or another defined basket, depending on the data source.
The useful question is not only whether the headline index rose or fell. The ratio asks whether the move had broad participation or depended on a smaller group of issues. A rising index with weak breadth can carry a different message from a rising index with many stocks participating.
| Input | Included in ADR | Not measured by ADR |
|---|---|---|
| Advancing issues | Yes, counted in the numerator | How far each issue advanced |
| Declining issues | Yes, counted in the denominator | How far each issue declined |
| Volume | No | Whether the move had strong or weak volume support |
| Sector concentration | No | Whether participation came from broad groups or only a few leaders |
| Price magnitude | No | Whether index movement was large or small |
How to Read Advance-Decline Ratio Values
A neutral advance-decline ratio is 1.0 because advancing and declining issues are equal. Values above or below that level show which side had more participation during the measured period.
| ADR reading | Basic meaning | Interpretation boundary |
|---|---|---|
| Above 1.0 | More issues advanced than declined | Positive breadth, but not automatic trend confirmation |
| At 1.0 | Advancers and decliners were balanced | Neutral participation, not necessarily neutral price action |
| Below 1.0 | More issues declined than advanced | Negative breadth, but not automatic reversal evidence |
| Rising over several readings | Participation is improving | Stronger if price behavior also broadens rather than narrows |
| Falling over several readings | Participation is weakening | More useful if weakness persists instead of appearing for one session |
Extreme values can be informative, but they are easy to overread. A very high ratio may reflect broad one-session participation, short-term relief after prior weakness, or a temporary imbalance that fades quickly. A very low ratio may reflect broad pressure, but the next readings determine whether weakness is persistent or only a short-lived flush.
Standalone vs Trended Advance-Decline Ratio
A standalone ADR value captures one measurement window. It can be useful for a quick breadth snapshot, but one value can be noisy because daily market participation changes quickly.
A trended reading compares the ratio across several sessions. Persistence gives the ratio more context because it shows whether participation is repeatedly broadening, repeatedly narrowing, or simply oscillating around neutral.
Standalone reading: useful for identifying the current participation balance, but vulnerable to one-session distortion.
Trended reading: more useful for judging whether breadth behavior is becoming persistent, fading, or diverging from headline index movement.
Advance-Decline Ratio Diagnostic Boundary
The advance-decline ratio becomes more useful when the value is separated from the interpretation. The value gives the participation count; the surrounding behavior decides whether the reading deserves more weight.
| Diagnostic layer | What to check | Safer interpretation |
|---|---|---|
| What ADR measures | Advancing issues divided by declining issues | Participation balance across the selected universe |
| What ADR misses | Volume, price distance, sector concentration, and durability | The ratio is incomplete unless other context supports breadth quality |
| Stronger reading | Ratio improves while the index also holds or advances with broader participation | Breadth is more consistent with the headline move |
| Weaker reading | Ratio fades while the index continues higher on narrower leadership | The headline move may be less broadly supported |
| False-positive risk | One-session spike reverses quickly or comes from a narrow recovery after prior pressure | The reading remains a breadth event, not durable confirmation |
Advance Decline Ratio vs Advance-Decline Line
The advance-decline ratio and the advance-decline line both use advancing and declining issues, but they answer different breadth questions.
The ratio shows the balance between advancers and decliners for a measured period. The line accumulates net advances over time, so it is better suited for observing cumulative breadth direction and longer participation trends.
| Indicator | Main calculation idea | Primary use |
|---|---|---|
| Advance-decline ratio | Advancing issues / declining issues | Session or period participation balance |
| Advance-decline line | Cumulative net advances | Cumulative breadth trend over time |
Common Mistakes When Reading the Advance-Decline Ratio
A high or low ADR value is easy to treat as a complete market message. That shortcut creates most interpretation errors because the ratio only counts participation direction.
Mistake 1: Treating a high ratio as a complete positive breadth message. A high reading only means advancers outnumbered decliners in the measured universe.
Mistake 2: Treating a low ratio as a complete negative breadth message. A low reading only means decliners outnumbered advancers during the measurement window.
Mistake 3: Ignoring index divergence. A rising index with a falling ratio may point to narrowing participation, not broad strength.
Mistake 4: Ignoring concentration. A few large issues can support an index even when many smaller components are not participating.
Mistake 5: Ignoring persistence. A one-session reading carries less weight than repeated breadth behavior across several sessions.
Example of an Advance-Decline Ratio Spike in Context
Price advances after a weak stretch, and the advance-decline ratio spikes because many issues in the selected universe close higher during the same session. The first read is broad participation, not durable confirmation.
Later sessions give the spike more weight if the ratio stays above neutral while the index holds its recovery and participation remains broad. The spike loses weight if the ratio quickly falls back below neutral and the index advance depends on a small group of large names.
The diagnostic question is whether the spike becomes persistent breadth or only a short-lived participation burst.
Related Breadth and Sentiment Context
ADR belongs to breadth analysis because it counts participation across advancing and declining issues. The put-call ratio reflects options-market sentiment instead, so the two readings should be compared only as separate context layers, not as the same type of market participation measure.
FAQ
What does an advance-decline ratio of 1 mean?
An advance-decline ratio of 1 means the number of advancing issues equals the number of declining issues in the measured universe.
What does a high advance-decline ratio mean?
A high advance-decline ratio means more issues advanced than declined in the measured universe. It can support a positive breadth reading, but it still needs context from persistence, index behavior, and participation quality.
How is the advance-decline ratio different from the advance-decline line?
The advance-decline ratio compares advancing issues with declining issues for a measured period, while the advance-decline line accumulates breadth over time.
Why can one-day advance-decline ratio readings mislead?
One-day readings can be distorted by short-term rebounds, narrow leadership, or temporary participation bursts. Repeated readings usually provide better context than a single value.
Does the advance-decline ratio include volume?
No. The advance-decline ratio counts advancing and declining issues. It does not measure volume, price distance, or how concentrated participation is across sectors or large names.