The advance decline line is a cumulative market breadth indicator that adds the daily difference between advancing issues and declining issues. It measures participation beneath index price, so it can help separate a broad market move from a move carried by only a smaller group of stocks.
Definition: The advance decline line tracks net advances over time. Each new value adds advancing issues minus declining issues to the prior cumulative value.
The indicator does not measure price size, volume intensity, options sentiment, or automatic reversal probability. Its value comes from showing whether more individual stocks are joining a move or whether index price is being supported by narrower leadership.
Key Points
- The advance decline line is cumulative, not a one-day ratio.
- A rising line reflects broader positive participation; a falling line reflects broader negative participation.
- Divergence can warn that participation is changing, but it does not forecast a reversal by itself.
- Readings depend on the stock universe being measured, such as NYSE, Nasdaq, S&P 500, or another defined basket.
What Is the Advance Decline Line?
The advance decline line is a market breadth tool used in technical analysis to compare index movement with the number of stocks participating in that movement. When an index rises and the line rises with it, participation is broader. When an index rises while the line stalls or falls, the price move may depend on fewer stocks.
The line is usually built from a defined exchange, index, or market universe. A reading based on the NYSE can differ from a reading based on Nasdaq or a narrower index basket because the underlying list of advancing and declining issues is different.
How the Advance Decline Line Is Calculated
The calculation starts with net advances:
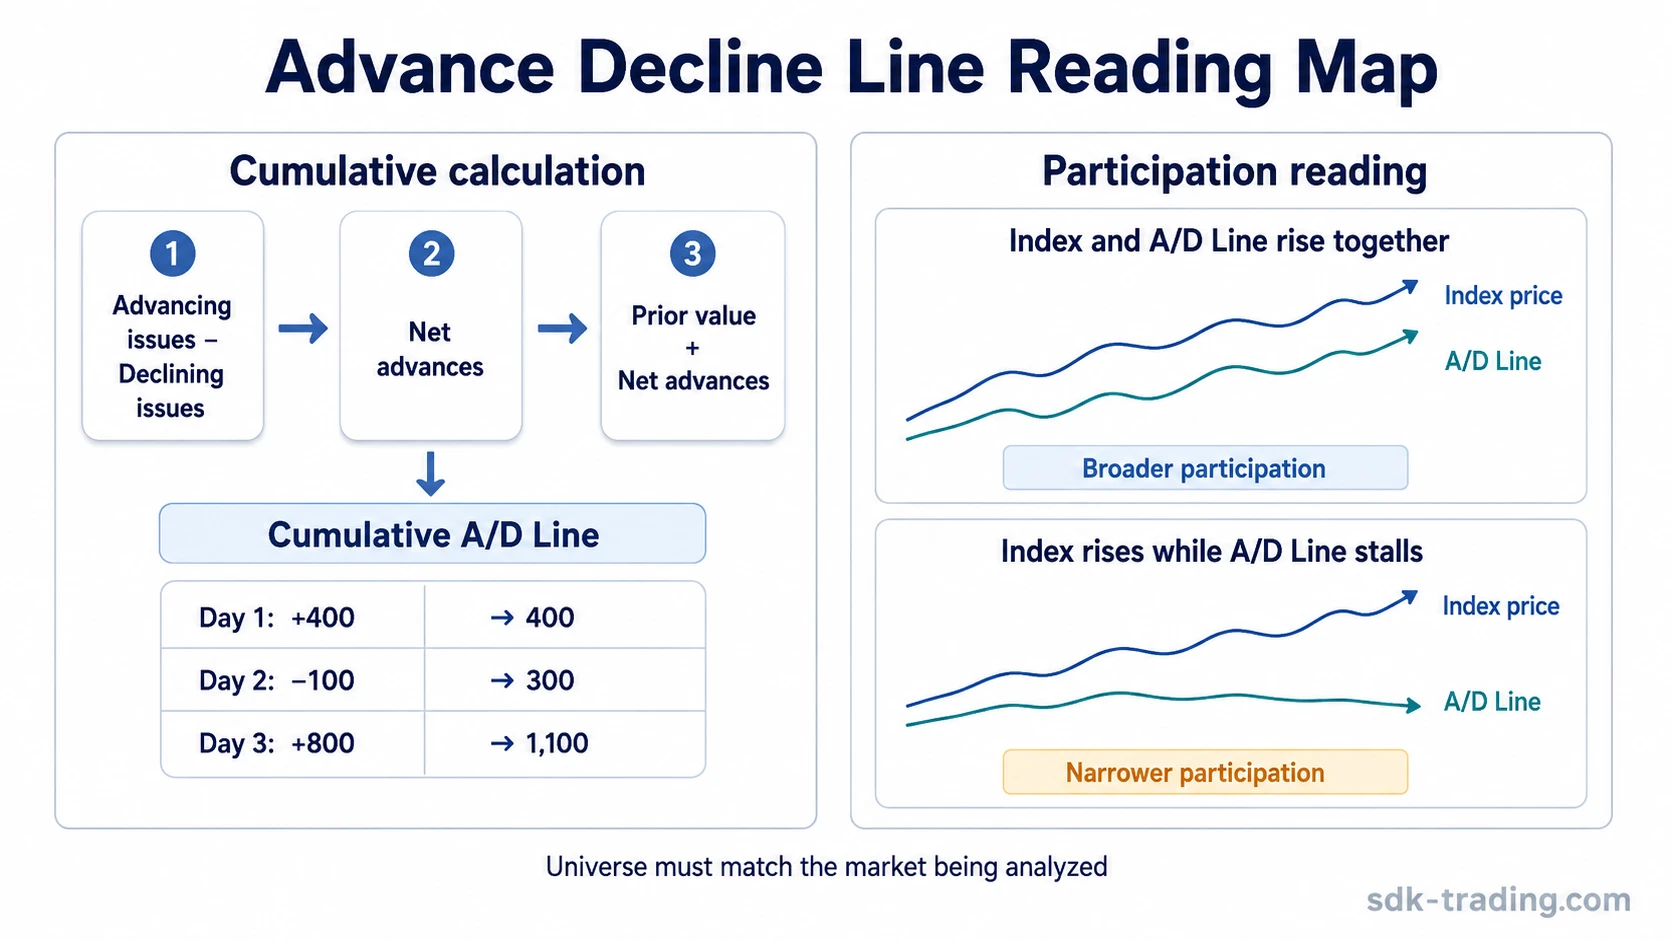
Formula: Net advances = advancing issues minus declining issues. Advance decline line = prior line value plus net advances.
A simple sequence makes the cumulative structure clear. The daily value is not read in isolation; it is added to the prior line value so participation can be tracked across time.
| Day | Advancing issues | Declining issues | Net advances | Cumulative A/D Line |
|---|---|---|---|---|
| Day 1 | 1,700 | 1,300 | +400 | 400 |
| Day 2 | 1,450 | 1,550 | -100 | 300 |
| Day 3 | 1,900 | 1,100 | +800 | 1,100 |
The starting value can be arbitrary. The slope and relative direction usually matter more than the absolute number, especially when comparing the line with an index over the same period.
Different data sources may use different market universes, so the line should be compared with the index or basket it is meant to describe.
What the Advance Decline Line Shows
A rising advance decline line means advancing issues are outnumbering declining issues on a cumulative basis. A falling line means declining issues are outnumbering advancing issues. A flat line suggests mixed participation, where neither side is dominating the issue count strongly enough to create a clear breadth direction.
| A/D Line behavior | Participation reading | Interpretation limit |
|---|---|---|
| Rising | More stocks are advancing than declining over time. | Broad participation can support the index move, but it does not define timing. |
| Falling | More stocks are declining than advancing over time. | Weak breadth can pressure index quality, but it does not prove immediate downside. |
| Flat | Participation is mixed or narrowing. | A flat line needs context from index behavior, market universe, and recent breadth bursts. |
The cumulative structure helps reveal whether participation has been building or deteriorating over several sessions rather than only on one strong or weak day.
Advance Decline Line Divergence
Divergence appears when index price and the advance decline line move in different directions. The most common warning occurs when an index keeps rising while the line flattens or declines. That can mean fewer stocks are carrying the index higher.
The opposite condition can also matter. If an index falls while the line begins to improve, the decline may be losing breadth pressure. That does not prove that price must recover, but it can show that participation is no longer weakening as broadly.
Limitation: Divergence is a condition, not a complete forecast. It becomes more useful when later price behavior, breadth persistence, and the measured universe support the same interpretation.
Diagnostic Boundary for the Advance Decline Line
The advance decline line is strongest when it is treated as participation evidence. It becomes less reliable when it is forced to explain price magnitude, volume pressure, or sentiment conditions that it was not designed to measure.
| Question | What the A/D Line can answer | What it cannot answer alone |
|---|---|---|
| Are many stocks joining the move? | Yes, through cumulative advancing minus declining issues. | It does not show how large each stock’s price move was. |
| Is index strength broad or narrow? | Often, by comparing line direction with index direction. | It does not remove the effect of cap-weighted index leadership. |
| Is divergence developing? | Yes, when line direction separates from index price direction. | It does not define reversal timing or execution. |
| Is market pressure volume-driven? | Only indirectly, if breadth confirms wider participation. | It does not measure volume intensity or buying and selling pressure by itself. |
Clean, Weak, and Invalid Readings
A useful A/D Line reading depends on alignment between the measured universe, index behavior, and participation trend. The same line movement can carry different meaning if the universe is narrow, stale, or mismatched against the index being compared.
| Reading type | Condition | Interpretation | What weakens it |
|---|---|---|---|
| Clean reading | The index rises while the A/D Line also rises across the same market universe. | Participation is broad enough to support the price move. | The reading weakens if only one short burst creates most of the line movement. |
| Weak reading | The index rises while the A/D Line flattens or drifts lower. | Leadership may be narrowing beneath the index. | The interpretation weakens if the compared index is dominated by a few large stocks and the breadth universe is much broader. |
| Invalid reading | The line is compared against the wrong index, stale data, or a universe that does not match the question. | The participation read may not describe the market being analyzed. | The reading should be discarded or reframed around the correct universe. |
Advance Decline Line Example in Context
An index pushes to a higher level while the advance decline line stops rising and moves sideways. The index move can still continue, but the breadth backdrop is narrower than before. The warning carries more weight if several later sessions keep showing limited participation; it loses force if the line recovers and broader participation returns.
The useful comparison is not whether divergence appears once. The stronger diagnostic question is whether breadth continues to support or reject the index move after the first mismatch appears.
Advance Decline Line vs Related Breadth Indicators
The advance decline line is one breadth view, not the whole breadth toolkit. Other indicators measure related but different participation, momentum, sentiment, or pressure conditions.
| Indicator | Main focus | How it differs from the A/D Line |
|---|---|---|
| Advance-decline ratio | One-period relationship between advancing and declining issues. | It is ratio-based rather than cumulative, so it emphasizes the current breadth balance more than the running line. |
| McClellan Oscillator | Smoothed breadth momentum. | It transforms advancing and declining issue data into an oscillator-style momentum reading. |
| New Highs New Lows | Leadership strength and weakness. | It focuses on stocks reaching extremes rather than all advancing and declining issues. |
| Put/Call Ratio | Options sentiment. | It reflects options activity rather than stock participation breadth. |
| TRIN | Breadth and volume pressure. | It compares advances and declines with advancing and declining volume, adding a volume-pressure layer. |
Common Mistakes With the Advance Decline Line
Treating divergence as a decision trigger: Divergence can warn that participation is changing, but it does not define an execution decision by itself.
Comparing the wrong universe: A breadth line based on one exchange may not describe a narrower index cleanly. The measured universe must match the market question.
Ignoring cap-weighted distortion: A cap-weighted index can rise while many individual stocks lag. The A/D Line helps reveal that mismatch, but it does not explain the full cause of the price move.
Overreading one-day bursts: A single strong breadth day can lift the cumulative line. The interpretation is more stable when participation persists instead of fading immediately.
Advance Decline Line FAQ
What does the advance decline line indicate?
The advance decline line indicates whether advancing issues are outnumbering declining issues on a cumulative basis. It is mainly a market breadth and participation measure.
How is the advance decline line calculated?
The line adds each period’s net advances to the prior value. Net advances equal advancing issues minus declining issues.
Is advance decline line divergence a reversal forecast?
No. Divergence can warn that participation is changing, but it does not forecast a reversal by itself. The interpretation needs context from price behavior, persistence, and the measured universe.