New Highs New Lows is a market breadth indicator that counts how many securities in a chosen market universe are making new highs or new lows over a selected lookback period.
Definition: New Highs New Lows tracks securities reaching selected-period high or low boundaries inside a defined market universe. It shows participation at price extremes rather than only whether a headline index is moving higher or lower.
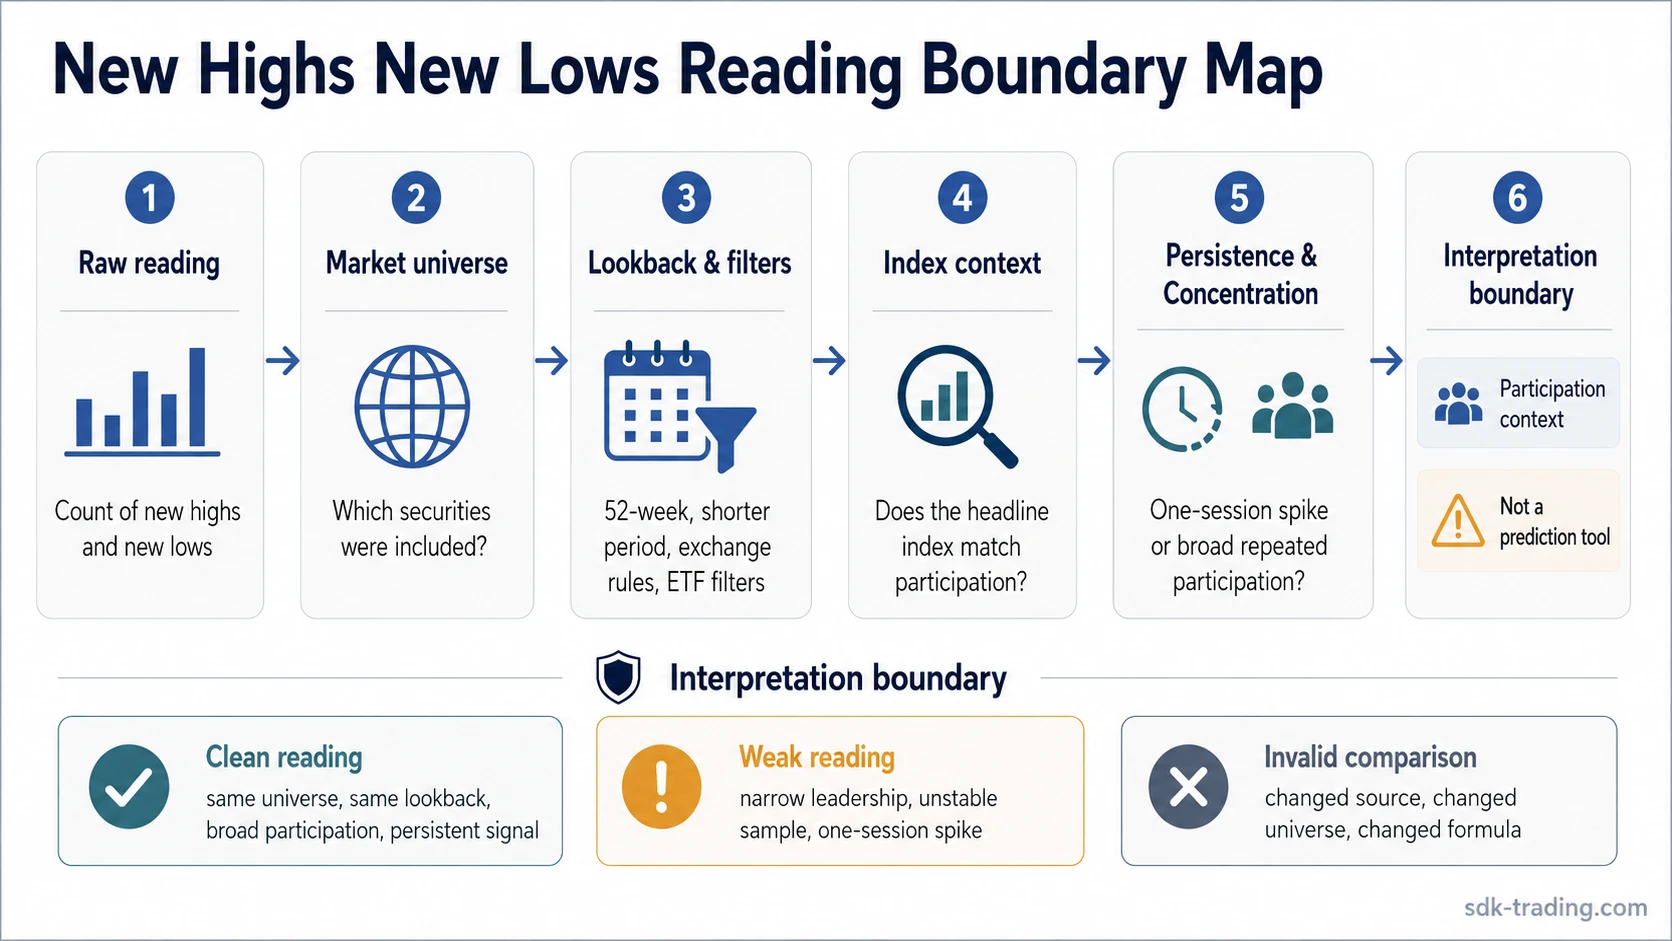
The raw count is not automatically bullish or bearish. The first interpretation question is what was counted: the universe, lookback, filters, concentration, and persistence all shape the reading.
Key Points
- New Highs New Lows measures securities reaching new high or new low boundaries inside a defined universe.
- The indicator is a market breadth measure, not a standalone timing or prediction tool.
- The same raw count can mean different things when the universe, lookback, or filters change.
- Clean readings require consistent data boundaries, broad participation, and persistence beyond one session.
- Net new highs minus new lows can help summarize breadth, but it can also hide dispersion when both extremes expand at the same time.
What New Highs New Lows Measures
New Highs New Lows measures boundary events. A security is counted as a new high when it reaches the highest price in the selected period. It is counted as a new low when it reaches the lowest price in that same type of period.
The most common version uses 52-week highs and 52-week lows, but the concept is not limited to 52 weeks. Some data tools may use shorter lookbacks, longer lookbacks, intraday rules, exchange-specific lists, or filtered universes.
That makes the indicator different from a simple price index. A headline index can rise because a small number of large components are strong, while fewer securities inside the same universe are reaching new highs. New Highs New Lows helps show whether participation is broad or narrow at the extremes.
The Common Misunderstanding
The common mistake is reading new highs as complete strength and new lows as complete weakness before checking the source of the count.
Common mistake: A high number of new highs is not automatically a complete strength reading, and a high number of new lows is not automatically a complete weakness reading.
Safer reading: First check the universe, lookback, filters, persistence, and concentration behind the reading.
A high number of new highs can look constructive, but it may be concentrated in a few sectors, ETFs, or large-cap names. A high number of new lows can look broadly weak, but it may come from a narrow or unstable sample.
The indicator is more useful when the same universe and same lookback are tracked consistently. It loses comparability when the source changes the sample, mixes different types of securities, or compares raw counts against a different formula.
Raw New Highs, Raw New Lows, and Net Balance
New Highs New Lows can appear in several formats. Some data sources show raw new highs and raw new lows as separate counts. Others show a net balance, often calculated as new highs minus new lows. Some tools also show normalized versions, but those should not be treated as identical to raw counts.
| Reading | Meaning | Main risk |
|---|---|---|
| Raw New Highs | Count of securities reaching a selected-period high | Can be concentrated in a few sectors or large names |
| Raw New Lows | Count of securities reaching a selected-period low | Can spike during one-day stress or low-liquidity conditions |
| Net NH-NL | New Highs minus New Lows | Can hide the fact that both extremes are expanding |
| High-Low Index | Normalized high-low breadth measure | Different formula; should not be treated as the same reading |
Raw new highs show how many securities are pushing into upper extremes. Raw new lows show how many are falling into lower extremes. Net NH-NL compresses those two counts into one balance.
That compression can be useful, but it can also hide dispersion. For example, a market with 250 new highs and 230 new lows has a positive net balance, but both extremes are active. That is a different condition from a market with 250 new highs and 20 new lows.
Why the Market Universe Changes the Reading
The universe is the group of securities being measured. This is one of the most important interpretation boundaries.
A New Highs New Lows reading for all NYSE-listed securities is not the same as a reading for Nasdaq stocks, S&P 500 components, ETFs, small-cap stocks, a sector list, or a custom filtered screen. The same raw count can mean broad participation in one universe and narrow participation in another.
| Universe or filter | Why it changes interpretation |
|---|---|
| NYSE vs Nasdaq | Different sector mix, listing profile, and security composition |
| Index components | A fixed index universe may behave differently from a broad exchange list |
| Stocks vs ETFs | ETF inclusion can add fund-structure noise to the count |
| Price filters | Low-priced securities may create readings that do not represent larger market participation |
| Volume filters | Thinly traded securities can distort raw extremes |
| OTC inclusion | OTC names can make the sample less comparable to major exchange readings |
| Traded-today rules | A security may be excluded if it did not trade during the measurement window |
| Total-return method | Adjusted data can differ from price-only high/low calculations |
A clean interpretation uses the same universe over time. If the universe changes, the reading may no longer be comparable with prior readings.
Why the Lookback Period Matters
The word “new” only has meaning after the lookback period is defined. A 52-week high means the highest price over roughly one year. A 20-day high means the highest price over a much shorter window. A multi-year high uses a longer boundary.
Shorter lookbacks tend to react faster, but they can also produce more frequent extremes. Longer lookbacks are slower and may identify more meaningful boundary events, but they can miss shorter participation shifts.
Lookback rule: A 52-week high list and a 20-day high list may both use the phrase “new highs,” but they do not measure the same boundary.
Different lookbacks should not be compared as if they were the same measurement.
Clean, Weak, and Invalid Readings
A New Highs New Lows reading should be classified before it is interpreted. The raw number is only the first layer.
| Reading status | What it means | Interpretation boundary |
|---|---|---|
| Clean | Same universe, same lookback, broad participation, persistent readings | More useful as breadth context |
| Weak | Narrow leadership, one-session spike, low-volume names, unstable sample | Treat as incomplete |
| Invalid or not comparable | Different universe, changed filters, different lookback, delayed data, raw count compared with normalized index | Do not compare directly |
A clean reading is not a forecast. It simply gives a more stable participation clue because the measurement boundary is consistent.
A weak reading may still matter, but it needs more context. Narrow leadership, one-session spikes, or unusual ETF participation can make the raw count look more meaningful than it is.
An invalid reading should not be forced into interpretation. If one source counts exchange-listed stocks and another includes ETFs, OTC names, or different filters, the readings may answer different questions.
How to Read New Highs New Lows in Market Context
New Highs New Lows becomes more useful when it is compared with headline index behavior.
A common scenario is that a headline index continues rising while the number of new highs narrows. That does not prove immediate weakness. It can show that fewer securities are carrying the move, especially if the same universe and lookback show the narrowing over several sessions.
The opposite situation can also matter. An index may look flat while new lows expand below the surface. That can show deterioration inside the measured universe even before the headline index reflects it clearly.
Another fragmented condition occurs when both new highs and new lows expand at the same time. In that case, the raw count does not give a clean broad-market message. It may show dispersion: some groups are reaching upper extremes while others are breaking lower within the same broader market.
The interpretation should stay conditional. The indicator provides participation context; it does not predict market turns by itself.
How It Differs From Other Breadth Indicators
New Highs New Lows overlaps with other breadth tools, but it does not measure the same thing.
| Indicator | Main input | How it differs from New Highs New Lows |
|---|---|---|
| New Highs New Lows | New high and new low counts inside a defined universe | Measures securities reaching selected-period extremes |
| High-Low Index | New highs and new lows, often normalized | The High-Low Index converts high-low participation into a normalized breadth reading |
| Advance Decline Line | Advancing issues minus declining issues | The Advance Decline Line measures broad participation, not only securities reaching extremes |
| McClellan Oscillator | Smoothed advance-decline breadth | The McClellan Oscillator measures breadth momentum rather than raw new high and new low events |
| Put Call Ratio | Options activity | The Put Call Ratio is more closely tied to options sentiment than to breadth participation |
TRIN combines advancing and declining issues with volume pressure. It is a breadth-pressure tool, not a count of securities reaching new high or low boundaries.
Practical Reading Sequence
A safer reading sequence starts with the data boundary before moving into interpretation.
| Step | Question to ask | Why it matters |
|---|---|---|
| 1. Universe | What securities were counted? | The same count can mean different things across different universes |
| 2. Lookback | What period defines “new”? | A 52-week reading and a shorter lookback do not measure the same boundary |
| 3. Format | Is the source showing raw highs, raw lows, net balance, or a normalized reading? | Different formats should not be compared as if they are identical |
| 4. Filters | Are ETFs, OTC names, price filters, or volume filters included? | Filters can materially change the shape of the reading |
| 5. Index context | What is the headline index doing? | Breadth can confirm, conflict with, or complicate index movement |
| 6. Persistence | Does the reading persist beyond one session? | One-day spikes can overstate the message |
| 7. Concentration | Is the reading broad or concentrated? | Narrow leadership can make raw strength look cleaner than it is |
| 8. Interpretation boundary | Is this context or a standalone signal? | The indicator provides participation context, not an automatic decision rule |
This sequence prevents the most common error: treating the number as meaningful before knowing what produced it.
Limitations
New Highs New Lows can become misleading when the measurement boundary is unstable.
| Limitation | Why it matters |
|---|---|
| Universe changes | A reading from one exchange or index may not match another universe |
| Lookback differences | A 52-week reading and a shorter-period reading answer different questions |
| ETF or OTC inclusion | Non-common-stock securities can change the shape of the count |
| Price and volume filters | Thin or low-priced securities can distort extremes |
| Delayed or incomplete data | Timing differences can make readings less comparable |
| One-session spikes | A single session may exaggerate stress or strength |
| Narrow leadership | A few sectors or large names may carry the reading |
| Simultaneous expansion | New highs and new lows can both rise in fragmented markets |
The indicator is strongest as a participation check. It is weaker when used alone, and it should not be treated as a prediction tool.
FAQ
What does New Highs New Lows measure?
New Highs New Lows measures how many securities in a selected universe reach new highs or new lows over a chosen lookback period.
Is New Highs New Lows the same as the High-Low Index?
No. New Highs New Lows often refers to raw counts or a net balance, while the High-Low Index normalizes the relationship between new highs and new lows.
Can New Highs New Lows predict market tops or bottoms?
No. It can provide breadth context, but it does not predict market turns by itself.
Why can different data sources show different New Highs New Lows readings?
They may use different universes, lookback periods, exchange rules, ETF inclusion rules, price or volume filters, and update times.