Volume indicators transform trading volume into a reading of participation, activity, pressure, or distribution. The main mistake is treating high volume as proof by itself. A large volume bar shows that many shares, contracts, or units changed hands, but it does not automatically explain whether price accepted that activity, rejected it, or failed to produce a clear result.
A useful volume reading starts with two separate questions. First, how much activity occurred? Second, what did price achieve during that activity? When volume expands but price closes weakly, stalls near the middle of the range, or fails to extend, the reading becomes less direct. The activity may be real, but the result may not support a strong directional interpretation.
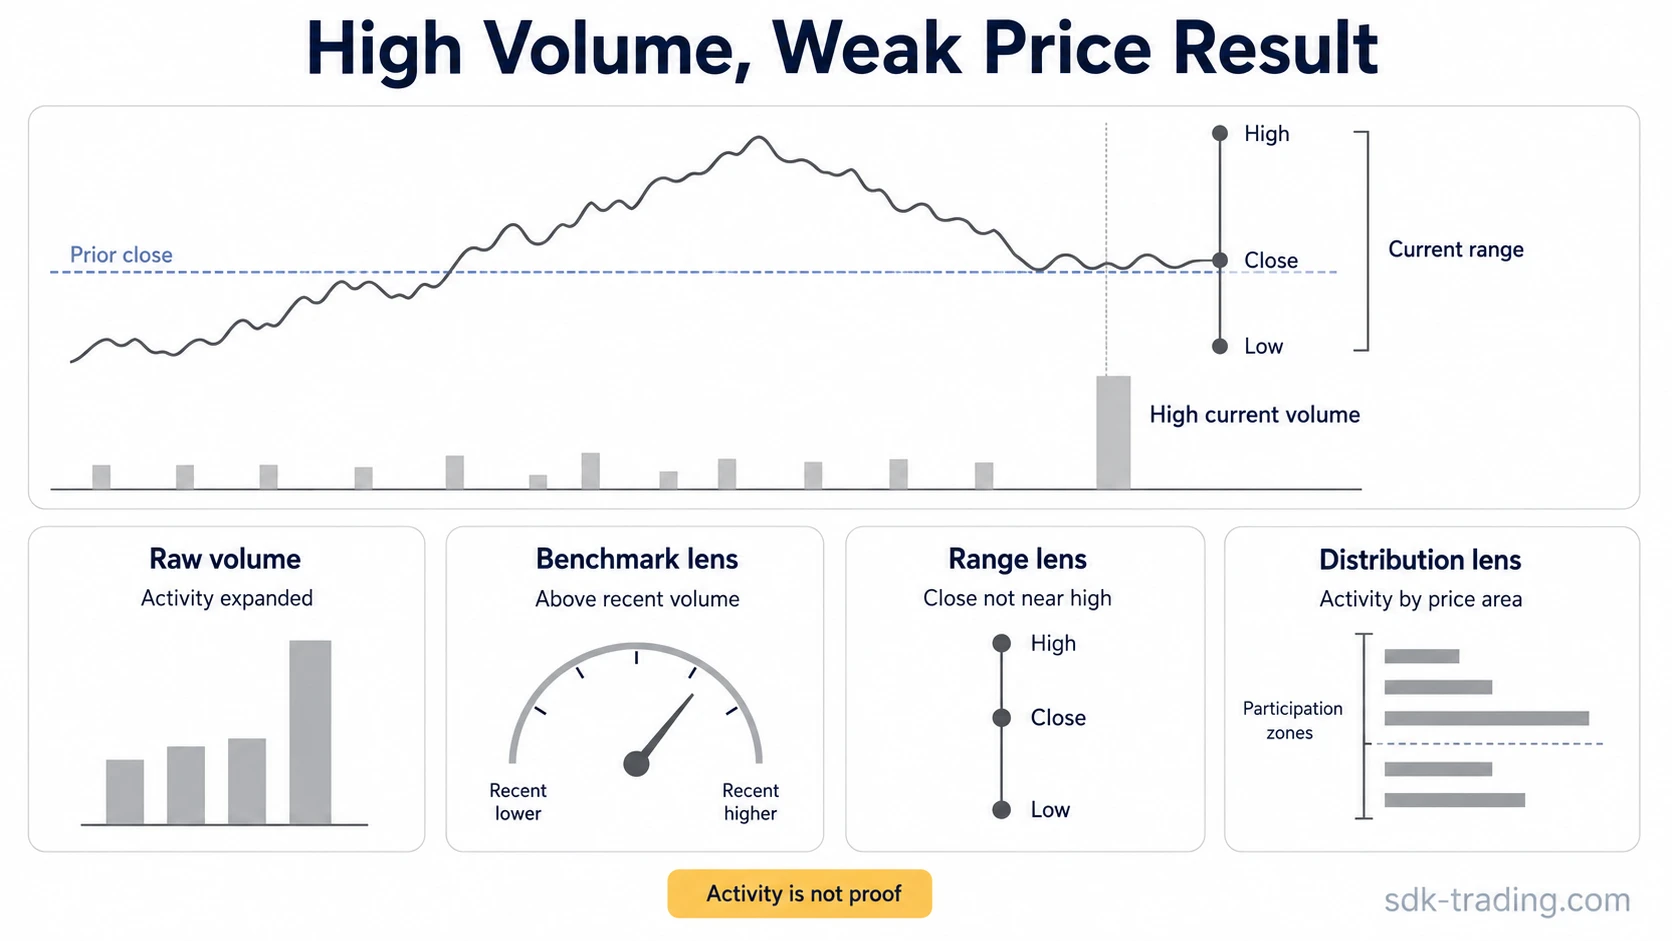
Key Points
- Volume indicators read participation through a calculation lens, not through raw volume alone.
- High volume can be misleading when price result is weak or unclear.
- Different volume indicators can disagree because they measure different parts of the same activity.
- A volume spike is not automatically bullish, bearish, or confirmatory.
- The safer question is what price achieved relative to the amount of activity shown.
What Volume Indicators Measure
Volume indicators measure trading activity and reshape it into a more readable form. Some tools accumulate volume over time. Some compare current activity with prior activity. Others combine volume with price change, price range, close location, or price-level distribution.
That makes a volume indicator different from the raw volume bar under a chart. Raw volume tells how much activity occurred during a period. An indicator tries to answer a narrower interpretation question, such as whether activity is expanding, whether it is above a recent average, whether it is concentrated at a price level, or whether it is being weighted by where the close occurred inside the range.
Definition: A volume indicator is a technical analysis tool that converts raw trading volume into a calculated reading of participation, activity, pressure, comparison, or distribution. The reading depends on the formula used, the market being measured, and the price result that appears alongside the volume.
Why High Volume Can Mislead
High volume means activity expanded. It does not automatically mean that buyers or sellers gained clear control. A strong interpretation needs a price result that matches the activity. If price moves strongly and closes near the extreme of its range, the volume reading may support the idea that participation aligned with price movement. If price moves sharply but closes back near the middle, the same volume expansion becomes more ambiguous.
The weak-result problem is simple: effort increased, but price did not clearly hold the result. That can happen during absorption, failed continuation, news-driven churn, low-liquidity spikes, opening gaps, or a single abnormal volume period. The indicator may still show large activity, but the price bar may show that the activity did not translate into clean acceptance.
Safer reading: Treat high volume as a reason for investigation, not as confirmation. Ask whether price expanded, closed strongly, held the range, or failed to produce a clear result.
Raw Volume vs Indicator Readings
Raw volume and volume indicators often sit close together on a chart, but they do not say the same thing. Raw volume is the input. The indicator is an interpretation layer built from that input.
| Input | What It Shows | What It Does Not Show | Common Misread | Safer Interpretation |
|---|---|---|---|---|
| Raw volume | How much trading activity occurred in the period. | Whether the activity produced useful price acceptance. | Assuming a spike confirms direction. | Compare the activity with the price result and the surrounding context. |
| Price change plus volume | Whether price movement occurred with larger or smaller participation. | Whether the move will continue. | Reading activity as a prediction. | Check whether price held the move after the activity expanded. |
| Close location inside the range | Whether the close finished near the high, low, or middle of the period. | What happened before the current range formed. | Ignoring gaps or earlier price displacement. | Separate the current-period range reading from prior-close behavior. |
| Volume by price level | Where activity concentrated across price zones. | Whether those zones will act as guaranteed reaction areas. | Treating a high-volume zone as automatic support or resistance. | Use the zone as participation context, then check current price behavior. |
How Different Volume Indicators Read the Same Activity
Volume indicators can disagree without one of them being wrong. Each formula asks a different question. A cumulative tool may emphasize direction over several periods. A threshold tool may emphasize whether current activity is unusual. A price-level tool may show where activity concentrated, while a range-based tool may focus on where the close finished inside the current bar.
A volume oscillator reading is mainly a comparison between shorter-term and longer-term volume behavior. It can show whether activity is expanding or contracting relative to a recent benchmark, but it does not explain price acceptance by itself.
A volume profile view organizes activity by price level rather than by time. It can show where participation was concentrated, but those concentrations remain context zones, not automatic outcomes.
| Indicator Family | Main Question | Useful For | Interpretation Risk |
|---|---|---|---|
| Cumulative volume flow tools | Is volume being accumulated into a running directional line? | Seeing whether a volume-based line rises, falls, or diverges over time. | The cumulative line can keep moving even when the newest price result is weak. |
| Oscillator or threshold tools | Is current volume high or low compared with a recent benchmark? | Spotting activity expansion, contraction, or abnormal volume conditions. | A high reading can describe intensity without proving direction. |
| Price-volume benchmark tools | How does price movement compare with the amount of volume behind it? | Separating active movement from quiet movement. | A large input can still be unclear if price fails to hold the result. |
| Price-level distribution tools | Where did the market do the most business by price level? | Understanding where participation concentrated across a range. | High activity at a level does not guarantee future reaction. |
| Close-location or range-weighted tools | Where did the close finish inside the current high-low range? | Reading whether the period closed near strength, weakness, or balance. | A range-based formula may focus on the current high-low range, so earlier gaps or broader context may need separate review. |
A Simple Weak-Result Scenario
Consider a period where volume expands far above its recent average. Price moves higher early, but the close finishes near the middle of the range. The raw volume bar shows strong participation. An oscillator-style tool may show that current activity is unusually high. A cumulative tool may add volume depending on the close-to-close direction. A range-weighted tool may produce a more cautious reading because the close did not finish near the top of the bar.
None of those readings has to be false. They are reading different boundaries. The raw volume reading says activity was high. The oscillator reading says activity expanded relative to a benchmark. The range-based reading says the final close was not especially strong inside that period. The safer interpretation is that participation increased, but the price result did not fully confirm that the activity produced clean directional control.
Example reading: “Volume expanded, but price failed to close strongly. That makes the activity notable, but the interpretation remains incomplete unless later price behavior shows acceptance or continuation.”
Common Mistakes With Volume Indicators
The most common mistake is reading any volume spike as confirmation. A second mistake is assuming that every volume tool measures the same thing. A third mistake is ignoring whether the market, instrument, session, or data feed produces volume data that is clean enough for the intended reading.
| Mistake | Why It Can Mislead | Safer Check |
|---|---|---|
| Treating high volume as automatic confirmation | High activity can appear during both acceptance and rejection. | Check what price achieved during and after the activity. |
| Ignoring the calculation lens | Different tools can turn the same activity into different readings. | Identify whether the tool is cumulative, comparative, range-based, or price-level based. |
| Reading a spike without context | A single abnormal period can distort the reading. | Compare the spike with nearby periods and the close location. |
| Ignoring data quality | Volume data can vary by market, instrument, session structure, and data feed, so the source should be understood before the reading is treated as reliable. | Know what the feed represents before comparing readings across instruments. |
Limits of Volume Indicator Readings
Volume indicators do not confirm direction by themselves. They do not predict continuation, measure trade quality, or replace the need to read price behavior. They are most useful when they clarify the relationship between activity and result.
A strong volume reading usually needs agreement between activity, price movement, close location, and follow-through. When those pieces conflict, the reading should become more cautious. Low-liquidity markets can produce noisier volume readings, and unusual sessions can make recent comparisons less stable.
Limitation: A volume indicator is a lens, not a verdict. The same high-volume period can look strong, weak, or unresolved depending on whether the formula emphasizes close direction, current range position, comparison with average volume, or price-level distribution.
FAQ
Are volume indicators the same as volume?
No. Volume is the raw amount of trading activity. A volume indicator applies a formula or comparison to that activity, so the reading depends on the calculation method.
Can high volume give a false reading?
High volume can be misleading when price result is weak or unclear. The activity may be real, but the interpretation remains incomplete if price fails to hold the move or closes poorly inside the range.
Why do volume indicators disagree?
Volume indicators can disagree because they use different inputs and formulas. One tool may compare current volume with an average, another may accumulate volume by close direction, and another may organize activity by price level or range position.
Is a volume spike always bullish or bearish?
No. A volume spike is a sign of activity, not a complete directional message. Its meaning depends on price result, close location, surrounding context, and the calculation method being used.