OBV and Accumulation Distribution are both cumulative volume indicators, but they assign volume for different reasons. OBV adds or subtracts the full period volume based on whether the current close is above or below the previous close. Accumulation Distribution weights volume by where the close sits inside the current period’s high-low range.
The difference matters when the two lines disagree. A chart can show a higher close versus the prior close, which pushes OBV higher, while the same bar closes weakly inside its own range, which can make Accumulation Distribution flat or negative. That disagreement is not a contradiction. It is the result of two different calculation lenses.
Key Points
- OBV reads close-to-close direction and assigns the full volume of the period to that direction.
- Accumulation Distribution reads the close’s location inside the current high-low range and weights volume through the money flow multiplier.
- Both indicators are cumulative, but their cumulative lines do not measure the same relationship.
- OBV can let one high-volume bar dominate the line because its volume assignment is binary.
- Accumulation Distribution can understate gap context because the standard formula focuses on the current period’s range.
- Divergence between price and either line is context, not a standalone trade signal.
OBV vs Accumulation Distribution: The Core Difference
The core difference between OBV and Accumulation Distribution is the condition that decides how volume is counted. OBV asks whether the current close is higher or lower than the previous close. Accumulation Distribution asks whether the current close finished near the high, middle, or low of the current period’s range.
OBV treats the close-to-close change as the main decision point. If the current close is higher than the prior close, the period’s full volume is added to the OBV line. If the current close is lower, the period’s full volume is subtracted. If the close is unchanged, OBV usually does not change.
Accumulation Distribution uses a more range-sensitive calculation. It does not simply ask whether the close rose or fell versus the prior close. It evaluates where the close sits between the current high and low. A close near the high creates a positive contribution, a close near the low creates a negative contribution, and a close near the middle creates a weaker or neutral contribution.
Simple distinction: OBV reads volume through closing direction. Accumulation Distribution reads volume through close location inside the current bar.
Formula Basis: Close Direction vs Close Location
OBV has a binary volume rule. The line changes by the full volume amount when the close changes direction versus the previous close.
OBV logic:
- If current close is above previous close: add current volume.
- If current close is below previous close: subtract current volume.
- If current close equals previous close: leave OBV unchanged.
Accumulation Distribution uses the money flow multiplier before volume is added to the cumulative line. The multiplier compares the close with the current high-low range.
Accumulation Distribution logic:
Money Flow Multiplier = ((Close – Low) – (High – Close)) / (High – Low)
Money Flow Volume = Money Flow Multiplier x Volume
Accumulation Distribution Line = Previous A/D Line + Money Flow Volume
This makes Accumulation Distribution more sensitive to the internal shape of the bar. A period can close above the previous close but still finish near the low of its own range. OBV treats that as positive because the close rose. Accumulation Distribution may treat it as weak or negative because the close finished poorly within the current range.
Side-by-Side Comparison Table
| Criterion | OBV | Accumulation Distribution | Reading implication |
|---|---|---|---|
| Main input | Close-to-close direction | Close location inside the high-low range | The two indicators can disagree even on the same bar. |
| Volume treatment | Full-period volume is added or subtracted | Volume is weighted by the money flow multiplier | OBV is binary; A/D is range-weighted. |
| Main reading | Directional volume assignment by closing change | Range-position money flow contribution | OBV focuses on whether the close advanced or declined; A/D focuses on where the close finished inside the bar. |
| Gap sensitivity | Captures prior-close direction because close-to-close movement matters | Can understate gap context if the close is strong inside the new range | A gap can make the two readings look inconsistent. |
| Range sensitivity | Does not care where price closes inside the bar | Strongly depends on close location inside the bar | A/D is usually more sensitive to upper-range and lower-range closes. |
| Best use lens | Directional participation by closing change | Intraperiod close-position pressure | The better lens depends on the question being asked. |
| Main misread | Treating all volume as equally meaningful because the close changed | Treating a high-range close as accumulation despite wider gap context | The formula can create a clean line while hiding important context. |
| Limitation | Binary full-volume assignment can let one bar dominate the line | Formula can be distorted by gaps, thin closes, or abnormal volume | Both lines need price structure and volume context around them. |
Same Scenario, Different Reading
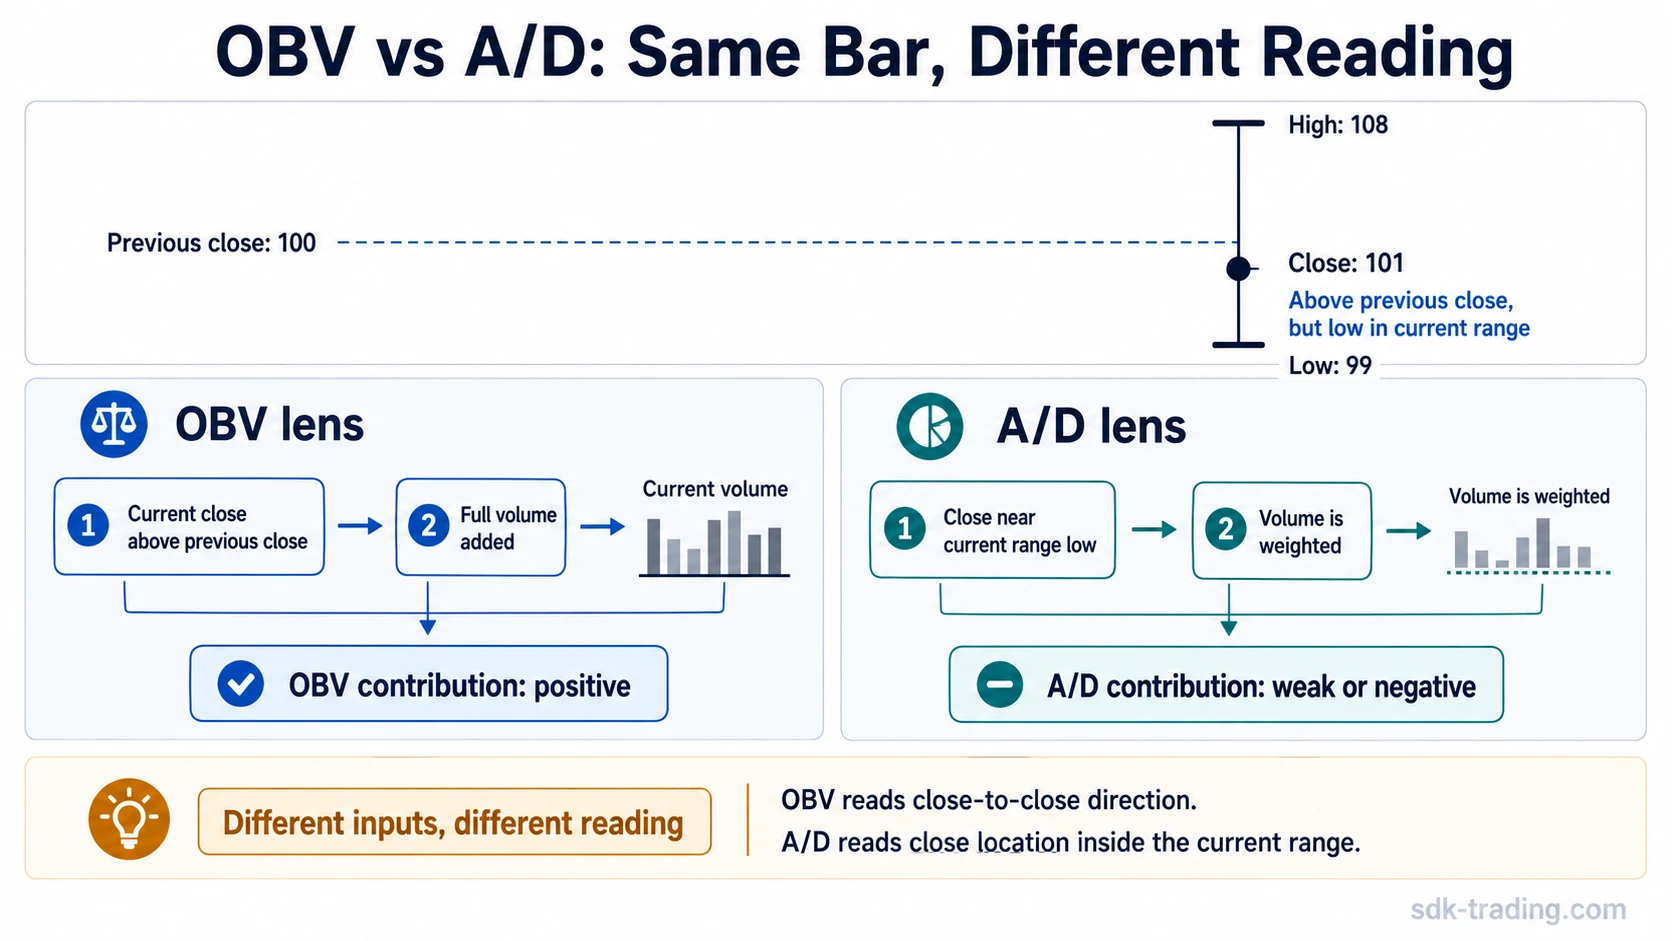
Consider a bar that closes above the previous close but finishes near the low of its own high-low range. OBV reads the higher close versus the prior close and adds the full volume of the period. Accumulation Distribution reads the weak close location inside the current range and may create a weak or negative money flow contribution.
Neutral bar sequence example:
- Previous close: 100
- Current high: 108
- Current low: 99
- Current close: 101
- Current volume: high relative to nearby bars
The current close is above the previous close, so OBV adds the full current volume. The same close is near the low of the current range, so Accumulation Distribution may produce a weak or negative contribution.
The useful interpretation is not that one line is correct and the other is wrong. OBV is answering whether the market closed higher than before. Accumulation Distribution is answering whether the close was strong inside the current period. Those are related questions, but they are not identical.
When Each Lens Is More Useful
OBV is more direct when the question is about closing direction and cumulative participation. Accumulation Distribution is more specific when the question is about whether closes are occurring near the high or low of each period’s range.
| Question | Better lens | Reason |
|---|---|---|
| Did closing direction change versus the prior close? | OBV | OBV is built directly from close-to-close direction. |
| Did price close strong or weak inside the current bar? | Accumulation Distribution | A/D weights volume by close location inside the period’s range. |
| Did a gap distort the reading? | Compare both | OBV reflects the close-to-close change, while A/D may focus on the new period’s internal range. |
| Is one large volume period dominating the line? | Use caution with both | Both indicators are cumulative and can be pulled by unusual volume. |
| Are the two lines disagreeing? | Start with formula difference | The disagreement often comes from close direction versus close location, not from a hidden signal. |
Neither indicator is inherently better. OBV is cleaner when the close-to-close question matters most. Accumulation Distribution is more detailed when the quality of the close inside the bar matters most. The stronger reading depends on whether the analysis is focused on directional closing assignment or intraperiod range position.
Why OBV and Accumulation Distribution Can Disagree
OBV and Accumulation Distribution can disagree because their formulas treat the same bar differently. OBV ignores the bar’s internal high-low position. Accumulation Distribution ignores the previous close except indirectly through how the current range forms.
1. A higher close can still be a weak close inside the bar: If price closes above the previous close, OBV adds the full period volume. If that same close is near the low of the current high-low range, Accumulation Distribution may assign a weak or negative contribution. The disagreement comes from the formula boundary, not from a hidden message in the indicator line.
2. A gap can change context: A/D focuses on the close’s location inside the current period’s range. If price gaps lower but then closes near the high of that lower range, A/D can create a positive contribution even though the broader close-to-close context may still look weak. OBV is more sensitive to the prior close because its rule is built around the current close versus the previous close.
3. Abnormal volume can dominate the cumulative line: Both indicators are cumulative. A sharp move in either line may reflect repeated contributions, but it may also reflect one abnormal-volume period. The line should be read with the surrounding price and volume sequence, not as an isolated conclusion.
4. Thin-liquidity closes can distort the reading: A close near the high or low of a thin period can push the A/D contribution strongly in one direction even when the bar is not a broad participation event. OBV can also move sharply if that period has high reported volume and the close changes direction versus the prior close.
Common Misreads and Limitations
Same chart does not mean same measurement. OBV and Accumulation Distribution can appear under the same price chart and both can be cumulative, but they are not measuring the same volume relationship.
Divergence is not a standalone signal. A difference between price and either line can help frame a question, but it does not define trade quality, entry timing, exit timing, targets, or risk by itself.
Positive OBV does not prove accumulation. OBV can rise because closing direction is positive. That does not automatically identify who is buying or whether the move is durable.
Positive A/D does not prove persistent buying pressure. A/D can rise because closes are near the high of their current ranges. Gaps, unusual volume, and thin closes can still distort the reading.
Summary
The safest distinction is mechanical. OBV converts close direction into cumulative volume. Accumulation Distribution converts close location into cumulative money flow volume. Once that boundary is clear, disagreement between the two indicators becomes easier to diagnose.
| Step | Check | Why it matters |
|---|---|---|
| Step 1 | Identify the close-to-close change | This explains the OBV contribution. |
| Step 2 | Locate the close inside the current range | This explains the Accumulation Distribution contribution. |
| Step 3 | Check for gaps | Gaps can make A/D look strong or weak while broader price context says something else. |
| Step 4 | Check for abnormal volume | One unusually large period can distort both cumulative lines. |
| Step 5 | Compare the indicator reading with price structure | The line becomes more useful when it is tied to actual price behavior rather than treated as a separate signal. |
FAQ
What is the main difference between OBV and Accumulation Distribution?
OBV uses close-to-close direction and adds or subtracts the full period volume. Accumulation Distribution uses the close’s location inside the current high-low range and weights volume through the money flow multiplier.
Why can OBV rise while Accumulation Distribution falls?
OBV can rise when the current close is above the previous close. Accumulation Distribution can fall if that same close is near the low of the current period’s range. The indicators are reading different parts of the bar.
Is OBV better than Accumulation Distribution?
Neither indicator is automatically better. OBV is more direct for close-to-close volume direction. Accumulation Distribution is more sensitive to where the close finishes inside the current range.
How do gaps affect Accumulation Distribution compared with OBV?
A gap can create a mismatch because OBV uses the current close relative to the previous close, while Accumulation Distribution focuses on the close location inside the current period’s high-low range. A strong close inside a lower gap range can still create a positive A/D contribution.