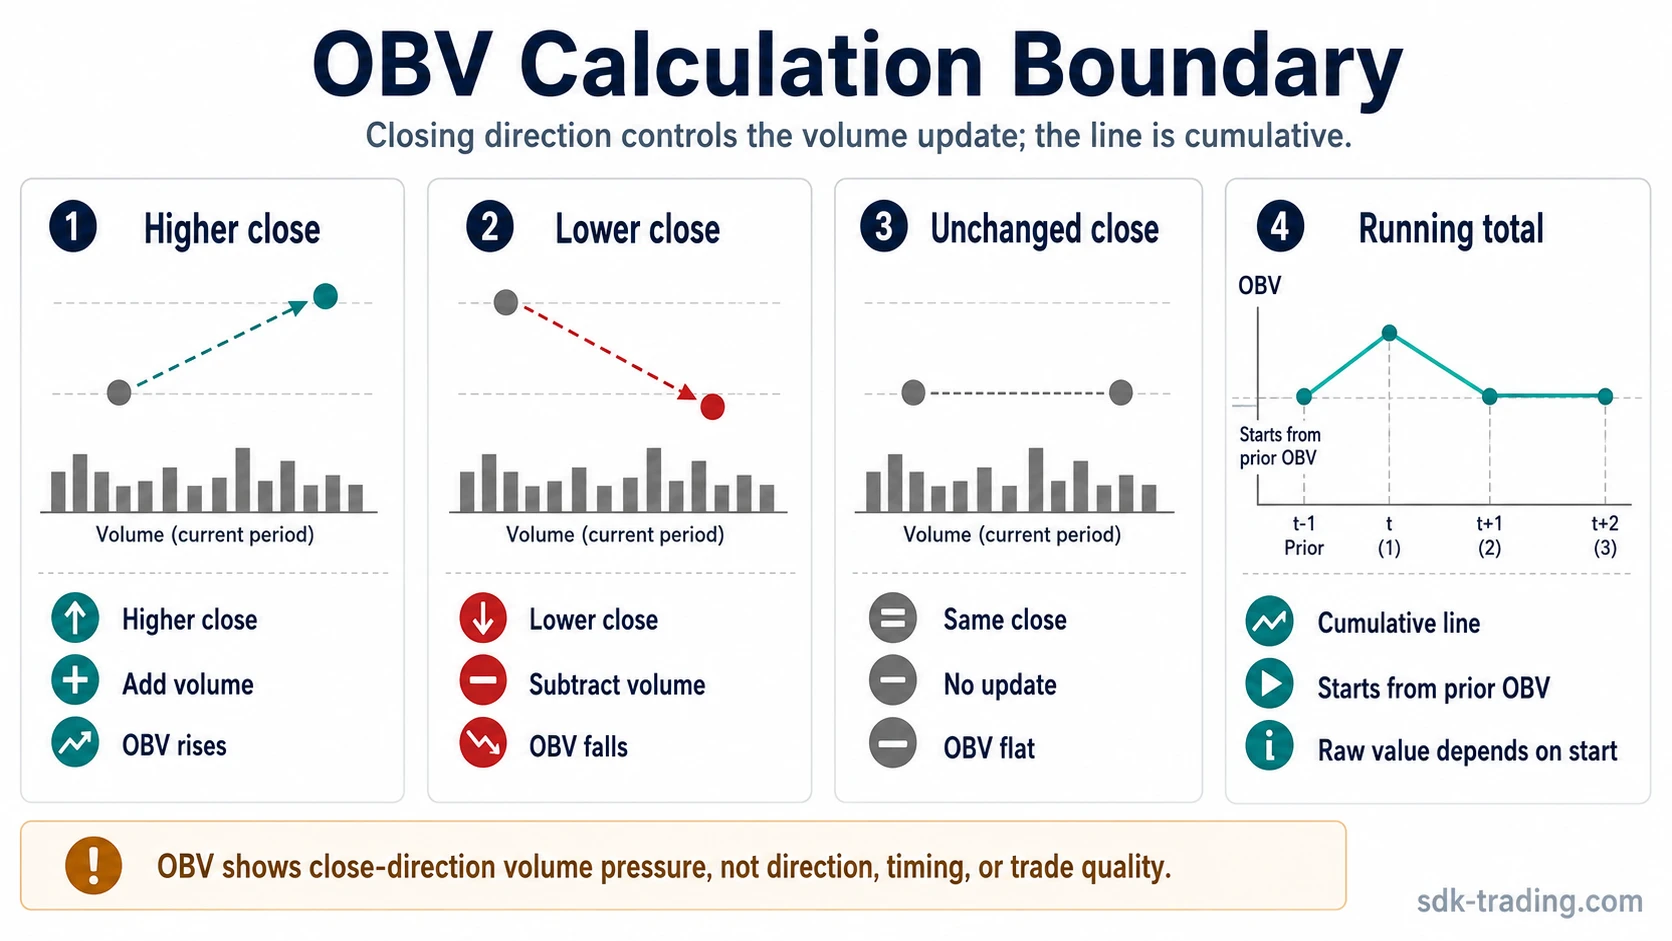
On Balance Volume (OBV) is a cumulative volume indicator that adds volume after a higher close, subtracts volume after a lower close, and leaves the running total unchanged when the close does not change.
Definition: On Balance Volume measures close-to-close volume pressure as a running line. It uses closing direction and volume, not the size of the price move, the intraday path, or volume distribution by price level.
The useful reading is usually the behavior of the OBV line over time and its relationship to price. A rising or falling OBV line can add context to participation, but OBV by itself does not define direction, timing, confirmation quality, or trade quality.
Key Points
- OBV is a cumulative close-direction volume measure.
- A higher close adds that period’s volume to the running total.
- A lower close subtracts that period’s volume from the running total.
- An unchanged close leaves OBV unchanged.
- The raw OBV value is less useful than slope, direction, changes, and relationship to price.
- Volume spikes, sideways alternation, and price-magnitude blind spots can distort the reading.
What Is On Balance Volume?
On Balance Volume belongs to the volume-indicator family of technical analysis tools. It converts each period’s volume into a cumulative running total based on whether the market closed higher, lower, or unchanged compared with the prior close.
The indicator does not identify participant intent directly. It applies a close-direction rule: if the close is higher, that period’s volume is treated as positive close-direction pressure; if the close is lower, that period’s volume is treated as negative close-direction pressure; if the close is unchanged, the OBV line does not move.
That makes OBV a broad participation measure rather than a full explanation of market behavior. It can help compare price movement with volume participation, but it cannot show why the volume appeared, whether the move was accepted, or whether a later reaction will confirm the reading.
How OBV Is Calculated
OBV uses three calculation rules. Each new period starts from the prior OBV value, then adds, subtracts, or preserves the current period’s volume according to the closing direction.
| Close condition | OBV rule | Interpretation boundary |
|---|---|---|
| Current close is higher than the previous close | Add current volume to OBV | Volume is counted as positive close-direction pressure |
| Current close is lower than the previous close | Subtract current volume from OBV | Volume is counted as negative close-direction pressure |
| Current close equals the previous close | Leave OBV unchanged | No close-direction change is recorded |
The formula can be written as a running update rather than a fixed standalone value:
OBV after a higher close: prior OBV + current volume
OBV after a lower close: prior OBV – current volume
OBV after an unchanged close: prior OBV
Simple OBV Calculation Example: A compact example can clarify why the line is cumulative and why the absolute number depends on the starting point.
| Period | Close vs prior close | Volume | OBV change | Running OBV |
|---|---|---|---|---|
| Start | Baseline | – | – | 0 |
| 1 | Higher | 120,000 | +120,000 | 120,000 |
| 2 | Lower | 90,000 | -90,000 | 30,000 |
| 3 | Unchanged | 75,000 | 0 | 30,000 |
| 4 | Higher | 150,000 | +150,000 | 180,000 |
The final value is not a universal threshold. A different chart history or starting point can create a different raw number, while the line’s behavior can still communicate the same close-direction volume pattern.
What OBV Can and Cannot Show
OBV is most useful when its boundary is kept clear. It describes how volume is accumulated through closing direction. It does not prove the cause of the volume, the quality of the price move, or the next market path.
| Reading area | What OBV can show | Boundary to keep |
|---|---|---|
| Direction of the line | Whether close-direction volume is accumulating upward, downward, or moving sideways | More useful when the direction persists; less reliable when one isolated spike controls the line |
| Relationship to price | Whether price movement and OBV movement are aligned or diverging | Useful as context, but still incomplete without surrounding price behavior |
| Participation change | Whether volume participation appears to be changing before or during a price move | Needs repeated behavior before the reading carries much weight |
| Divergence | Whether price and close-direction volume are no longer moving together | Best treated as a warning condition, not as a complete conclusion |
| Raw value | The cumulative total from the chosen starting point | The number is chart-history dependent and should not be treated as a universal level |
How OBV Compares With Price
OBV is usually read beside price, not in isolation. The same OBV movement can carry different weight depending on whether price is trending, ranging, rejecting a move, or moving with unstable volume.
Price and OBV Rising Together: When price rises and OBV also rises, the close-direction volume reading is aligned with the price move. The interpretation is cleaner when the movement is consistent across several periods rather than driven by one unusually large volume bar.
Price and OBV Falling Together: When price falls and OBV falls with it, the close-direction volume reading is aligned on the downside. That can describe negative participation pressure, but it still needs price context before any broader conclusion is drawn.
OBV Divergence: Divergence appears when price and OBV move in different directions. Price may push higher while OBV fails to confirm the move, or price may press lower while OBV stops making comparable lows. Divergence is best treated as a warning condition or context shift, not as a complete conclusion.
Range Behavior and Alternating Closes: In a sideways range, alternating higher and lower closes can make OBV choppy. The line may rise and fall without creating a clean participation reading, especially when the price range is narrow and volume varies sharply from period to period.
Clean comparison: price direction, OBV direction, and surrounding behavior support the same interpretation.
Weak comparison: price and OBV are slightly misaligned, but the difference is small, unstable, or range-bound.
Misleading comparison: one volume spike or a noisy sideways sequence makes the OBV line look more meaningful than the price behavior supports.
When OBV Readings Become Weak or Misleading
OBV can lose clarity when the calculation rule records volume pressure that the broader price behavior does not support. The most common issue is not the formula itself; it is reading more from the line than the inputs can justify.
| Condition | Why it can distort OBV | Safer interpretation |
|---|---|---|
| Large one-period volume spike | A single higher or lower close can move the cumulative line sharply | Check whether later price behavior accepts or rejects the move before giving the spike too much weight |
| Sideways alternation | Small close changes can repeatedly add and subtract volume without a clean directional message | Treat the OBV line as noisy until price leaves the range with clearer participation behavior |
| Price magnitude excluded | A small higher close and a large higher close both add that period’s volume | Separate the close-direction reading from the strength of the price movement |
| Intraday path ignored | OBV only compares closes and does not show where volume occurred inside the period | Use the line as a closing-pressure measure, not as a full intraday volume map |
| Arbitrary starting value | The absolute OBV number depends on where the running total begins | Compare line behavior and changes over time instead of treating the raw value as a universal level |
Main limitation: OBV compresses price-volume behavior into one close-direction rule. That makes it readable, but it also means the line can miss price magnitude, intraday rejection, volume-by-price location, and the reason volume appeared.
OBV vs Other Volume Indicators
OBV is easiest to understand when it is separated from nearby volume tools. Several indicators use price and volume, but they do not measure the same input.
| Indicator | Main input focus | How it differs from OBV |
|---|---|---|
| Accumulation/Distribution | Close location inside the period’s high-low range, weighted by volume | OBV uses close-to-close direction, while A/D gives more attention to where the close sits within the period’s range |
| VWAP | Volume-weighted average price | OBV is a cumulative pressure line, while VWAP is a price benchmark weighted by traded volume |
| Volume Profile | Volume participation by price level | OBV tracks cumulative volume through time, while Volume Profile shows where participation occurred across price levels |
| Chaikin Money Flow | Volume-weighted close-location pressure over a lookback window | OBV is cumulative and close-direction based; CMF is bounded around a zero line and depends on close location within each period’s range |
| Force Index | Price change multiplied by volume | OBV ignores price-change size, while a volume-force reading includes the size of the price change in its calculation logic |
Practical OBV Reading Checklist
A practical OBV reading starts with the formula inputs and then checks whether price behavior supports the same interpretation. The goal is to separate a useful diagnostic reading from a noisy line movement.
| Check | Question | Why it matters |
|---|---|---|
| Close direction | Are higher closes or lower closes controlling the OBV changes? | OBV only changes through close-to-close direction |
| Volume contribution | Are changes broad and repeated, or dominated by one bar? | Single spikes can distort the cumulative line |
| OBV slope | Is the line rising, falling, flat, or choppy? | The slope usually matters more than the raw OBV number |
| Price relationship | Is price aligned with OBV, diverging from it, or moving sideways? | The same OBV movement can mean different things in a trend, range, or failed move |
| Failure conditions | Is the reading affected by sideways alternation, small close changes, or abnormal volume? | These conditions can turn a clean-looking line into a weak or misleading reading |
FAQ
Is OBV a complete trading signal?
No. OBV describes cumulative close-direction volume pressure. It can add context to price behavior, but it does not define direction, timing, confirmation quality, or trade quality by itself.
Why can OBV diverge from price?
OBV can diverge from price when the close-direction volume pattern does not confirm the price movement. The divergence can warn that participation is changing, but it still needs surrounding price behavior before the reading becomes useful.
Does the absolute OBV value matter?
The absolute OBV value is usually less important than the line’s behavior. Because OBV is cumulative, the raw number depends on the starting point and chart history, while slope, changes, and relationship to price often carry more interpretive value.