Force Index is a volume-based momentum indicator that multiplies close-to-close price change by volume. It shows how much price displacement occurred with participation behind it, but it does not identify a complete trade setup, support level, resistance level, or institutional activity by itself.
Inside the volume-indicator family, Force Index has a narrower job than many nearby tools. It does not simply add or subtract volume like OBV, and it does not score where the close sits inside the candle range like Chaikin-style indicators. Its reading is built from one direct relationship: how far the close moved from the previous close, multiplied by the current period’s volume.
Key Points
- Force Index measures close-to-close price change multiplied by current-period volume.
- Positive readings show upward close-to-close displacement weighted by volume.
- Negative readings show downward close-to-close displacement weighted by volume.
- Near-zero readings can come from small price change, low volume, or offsetting movement.
- Smoothing can make the line easier to read, but it can also delay or soften sudden volume shocks.
- The indicator does not measure order flow, volume by price level, or the close’s location inside the high-low range.
What Is the Force Index?
The Force Index is a technical indicator introduced by Alexander Elder to combine price movement and volume into one oscillator-style reading. Its purpose is to show whether the latest close-to-close price change occurred with a larger or smaller amount of trading activity.
The word “force” can be misleading if it is read too literally. A high reading does not prove buyer control, and a low reading does not prove seller control. The indicator only shows the calculated size of price displacement after volume has been applied to it.
Definition: Force Index is a volume-based momentum indicator that multiplies the current close minus the previous close by current volume.
This makes it useful as a diagnostic reading. It can help separate a small price move on light volume from a larger close-to-close displacement on heavier volume. It should still be read as one calculation lens, not as a full interpretation of market structure.
Force Index Formula and Calculation
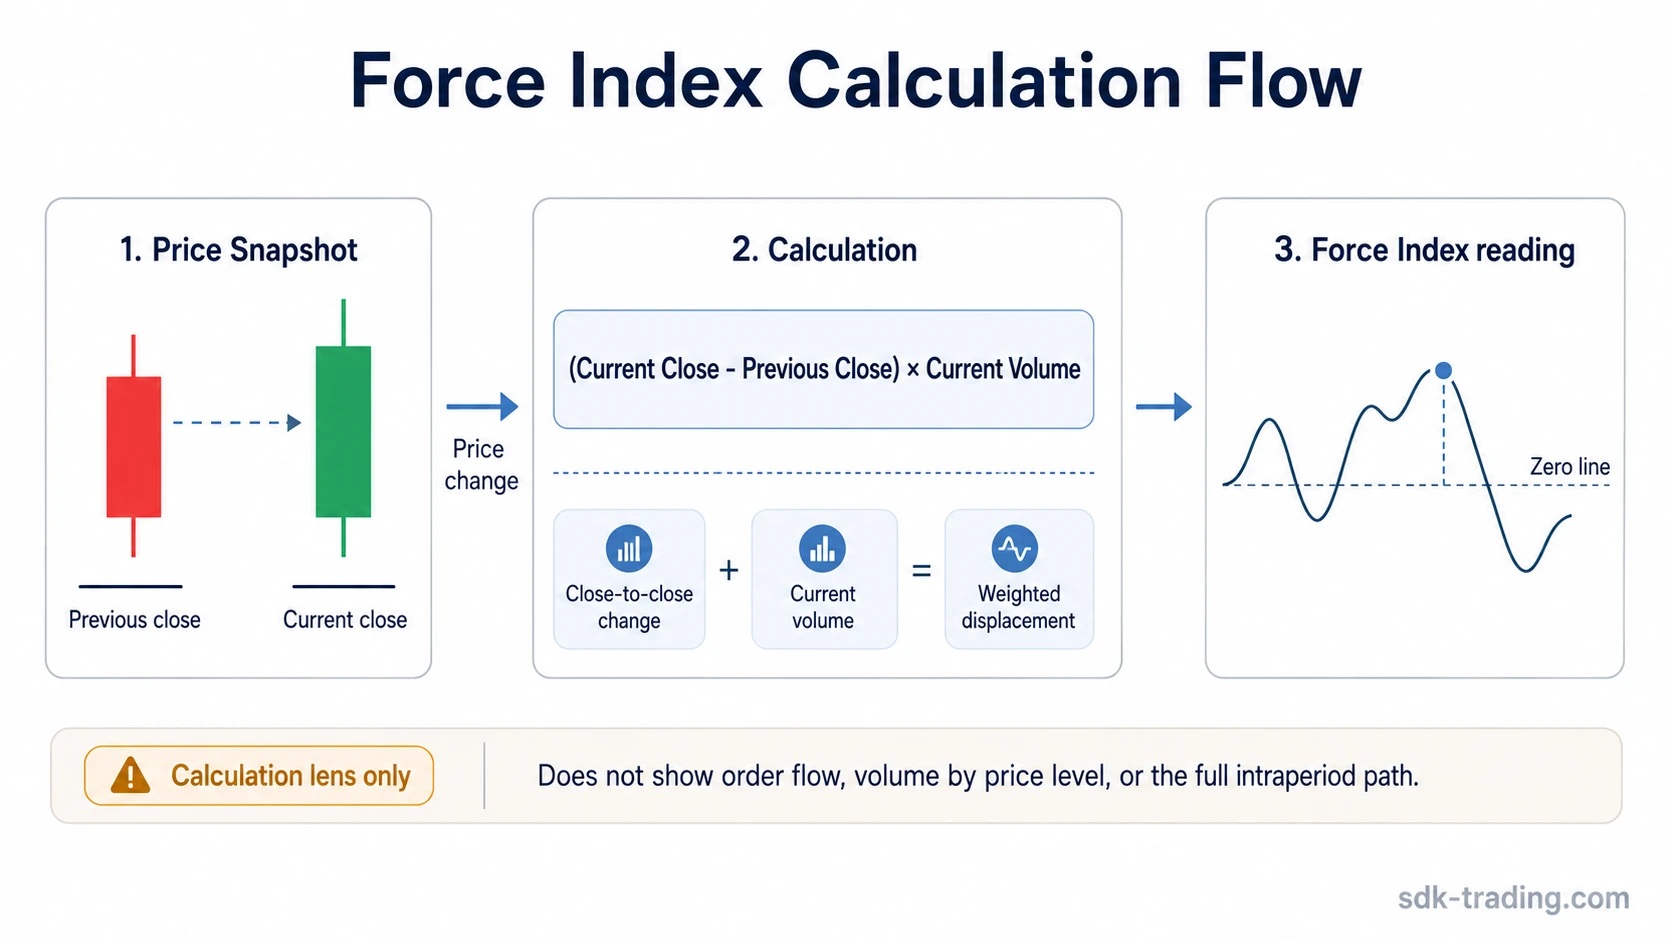
The standard one-period Force Index formula is:
Force Index = (Current Close – Previous Close) x Current Volume
The current close and previous close define the direction and size of the price change. Current-period volume then scales that price change. A larger close-to-close move with high volume produces a larger absolute Force Index value than the same price move with lower volume.
| Formula component | Role in the reading |
|---|---|
| Current close | Sets the latest closing price used in the comparison. |
| Previous close | Provides the reference point for the close-to-close change. |
| Current volume | Weights the price change by participation during the current period. |
| Positive or negative result | Shows whether the latest close-to-close displacement was upward or downward. |
The calculation has clear boundaries. It does not inspect the full candle range, the intraday path, order-book depth, volume traded at each price level, or whether the move came from broad participation or one concentrated event. It only combines close-to-close change and current-period volume.
How to Read Positive, Negative, and Near-Zero Values
Force Index moves around a zero line. The zero line is not a trading command. It is the point where the close-to-close price change has no positive or negative displacement after the formula is applied.
| Reading | What it describes | What it does not prove |
|---|---|---|
| Positive Force Index | The current close is above the previous close, and the move is weighted by current volume. | It does not prove continuation, accumulation, or trade quality. |
| Negative Force Index | The current close is below the previous close, and the move is weighted by current volume. | It does not prove distribution, reversal, or a valid short setup. |
| Near-zero Force Index | The close-to-close change is small, volume is low, or the movement is not creating a large calculated displacement. | It does not automatically mean the market is balanced or inactive. |
A positive value is best read as upward close-to-close displacement with volume behind that closing change. A negative value is downward close-to-close displacement with volume behind it. Near-zero values need context because they can come from different conditions: low volume, a very small price change, or a period where price moved inside the bar but closed near the prior close.
Why Force Index Is Often Smoothed
The raw one-period Force Index can be jagged because it reacts directly to each close-to-close change and each volume input. A single large candle or abnormal volume bar can dominate the reading for that period.
Many charting platforms therefore show a smoothed Force Index, often using an exponential moving average. Smoothing can reduce noise and make the broader line easier to inspect. The tradeoff is that the smoothed version no longer shows each raw one-period shock as directly.
| Smoothing choice | Effect on the indicator | Main limitation |
|---|---|---|
| Raw or very short smoothing | Responds quickly to the latest price-volume change. | Can be unstable and dominated by one-bar noise. |
| Moderate smoothing | Reduces some noise while still responding to recent changes. | Can soften the effect of abrupt participation shifts. |
| Longer smoothing | Creates a calmer line that is easier to compare across periods. | Introduces more lag and may hide single-period shocks. |
Smoothing changes readability. It does not make the indicator more truthful. A clean line can still be delayed, and a jagged raw line can still contain distortions from gaps, news shocks, or thin-liquidity closes.
What the Force Index Can Miss
The Force Index can look decisive when the underlying market information is incomplete. Its formula does not know whether price moved steadily through the period, opened with a gap, reversed intraperiod, or traded with uneven liquidity.
Limitation example: A large close-to-close gap with high volume can create a large Force Index reading even if the period itself does not show sustained intraperiod participation. The formula captures the close-to-close displacement and volume, not the full path between the two closes.
Several conditions can distort interpretation:
- Gaps: A gap can create a large close-to-close change before the current period’s internal structure is considered.
- Abnormal one-bar volume: One event-driven volume bar can dominate the reading.
- Thin liquidity: A small amount of activity can move price enough to exaggerate the result.
- News or event shocks: The indicator records the price-volume outcome, not the reason behind it.
- Smoothing lag: A smoothed Force Index can respond after the raw condition has already changed.
- Divergence persistence: A divergence can remain visible for a long time without forcing reversal or continuation.
The safer reading is mechanical: Force Index shows what changed from close to close and how much volume was attached to that change. It does not explain the complete cause of the move.
Force Index vs OBV and Chaikin Money Flow
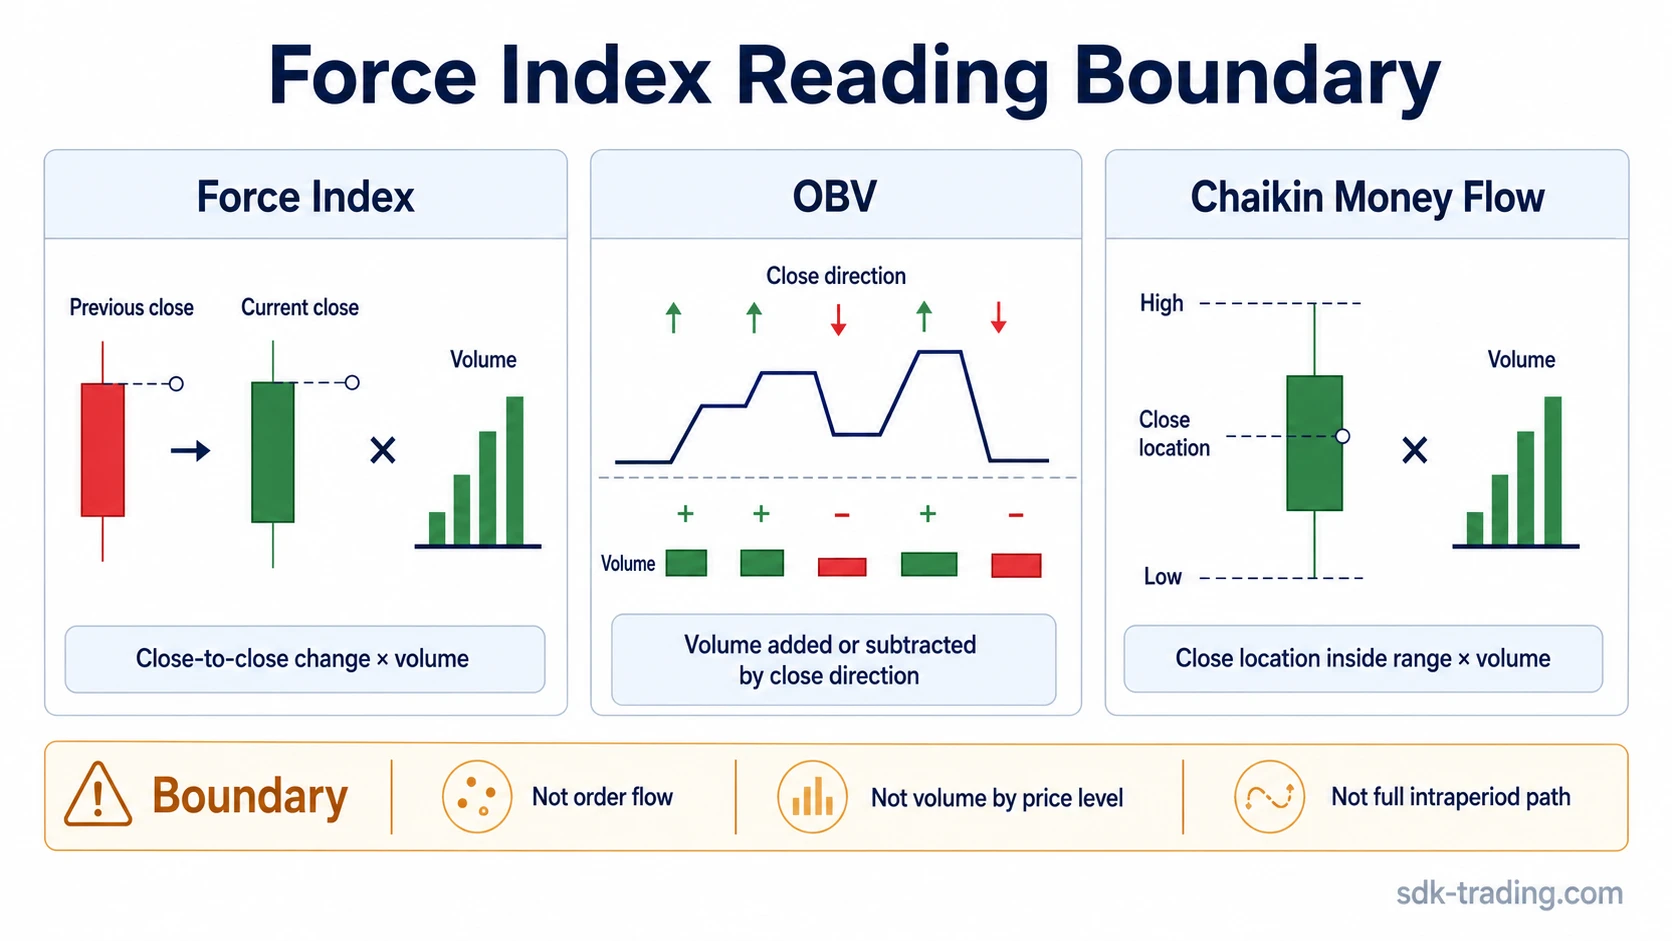
Force Index is often grouped with other volume indicators, but its calculation lens is different. OBV accumulates volume according to close direction, while Force Index multiplies the size of the close-to-close change by volume.
A separate comparison is the close-location family of indicators. A close-location volume reading such as Chaikin Money Flow uses where the close sits inside the period’s high-low range, not the close-to-close displacement used by Force Index.
| Concept | What it measures | Main difference from Force Index |
|---|---|---|
| Force Index | Close-to-close price change multiplied by volume. | Weights price displacement by current-period volume. |
| OBV | Cumulative volume added or subtracted by close direction. | Does not multiply volume by the size of the price change. |
| Chaikin Money Flow | Close location inside the high-low range, volume-weighted. | Uses range location instead of close-to-close displacement. |
| Accumulation Distribution | Close location multiplier multiplied by volume, then accumulated. | Focuses on where the close sits inside the bar. |
| Volume Profile | Volume by price level. | Is not a time-series momentum oscillator. |
| Raw Volume | Activity amount during the period. | Has no price direction or displacement calculation by itself. |
The same chart can produce different readings because each indicator selects a different part of the price-volume record. Force Index may respond strongly to a large close-to-close move with high volume, while a range-location indicator may respond differently if the close finishes near the middle of the high-low range.
Force Index Reading Boundary
The most useful reading boundary is simple: Force Index answers “what changed from close to close, and how much volume was attached to that closing change?” It does not answer whether the move should be traded, whether the move is caused by accumulation or distribution, or whether the next price move is likely to continue.
The reading becomes more useful when chart structure, volume source, gaps, liquidity, and nearby indicators are checked separately. Without those checks, Force Index remains a price-volume displacement calculation.
Reading rule: Treat Force Index as an input about participation-weighted close-to-close displacement. Do not treat it as a complete signal, prediction model, or proof of market intent.
FAQ
What does the Force Index measure?
Force Index measures close-to-close price change multiplied by current-period volume. It shows price displacement with volume weighting, not a complete trading decision.
What is the Force Index formula?
The standard formula is: Force Index = (Current Close – Previous Close) x Current Volume.
Is a positive Force Index always bullish?
No. A positive Force Index means the current close is above the previous close after volume weighting. It does not prove continuation, accumulation, or trade quality.
How is Force Index different from OBV?
OBV accumulates volume based on whether the close is higher or lower than the previous close. Force Index multiplies the size of the close-to-close price change by current-period volume.