Chaikin Money Flow is a volume-based oscillator that weights volume by where price closes inside each period’s high-low range. It can help describe whether recent volume is being associated with closes toward the upper or lower part of the range, but it does not confirm direction, reversal timing, or trade quality by itself.
Definition: Chaikin Money Flow, often shortened to CMF, compares the sum of volume weighted by close location with total volume over a selected lookback period.
- CMF rises when more volume is attached to closes near the upper part of the high-low range.
- CMF falls when more volume is attached to closes near the lower part of the high-low range.
- Readings near zero show a more balanced or unstable money-flow reading.
- The reading is context for pressure, not a complete trading decision.
What Is Chaikin Money Flow?
Chaikin Money Flow is a technical indicator designed to estimate accumulation and distribution pressure over a lookback window. Instead of looking only at whether price closes up or down, CMF asks where the close sits within the period’s full range and then applies that location to volume.
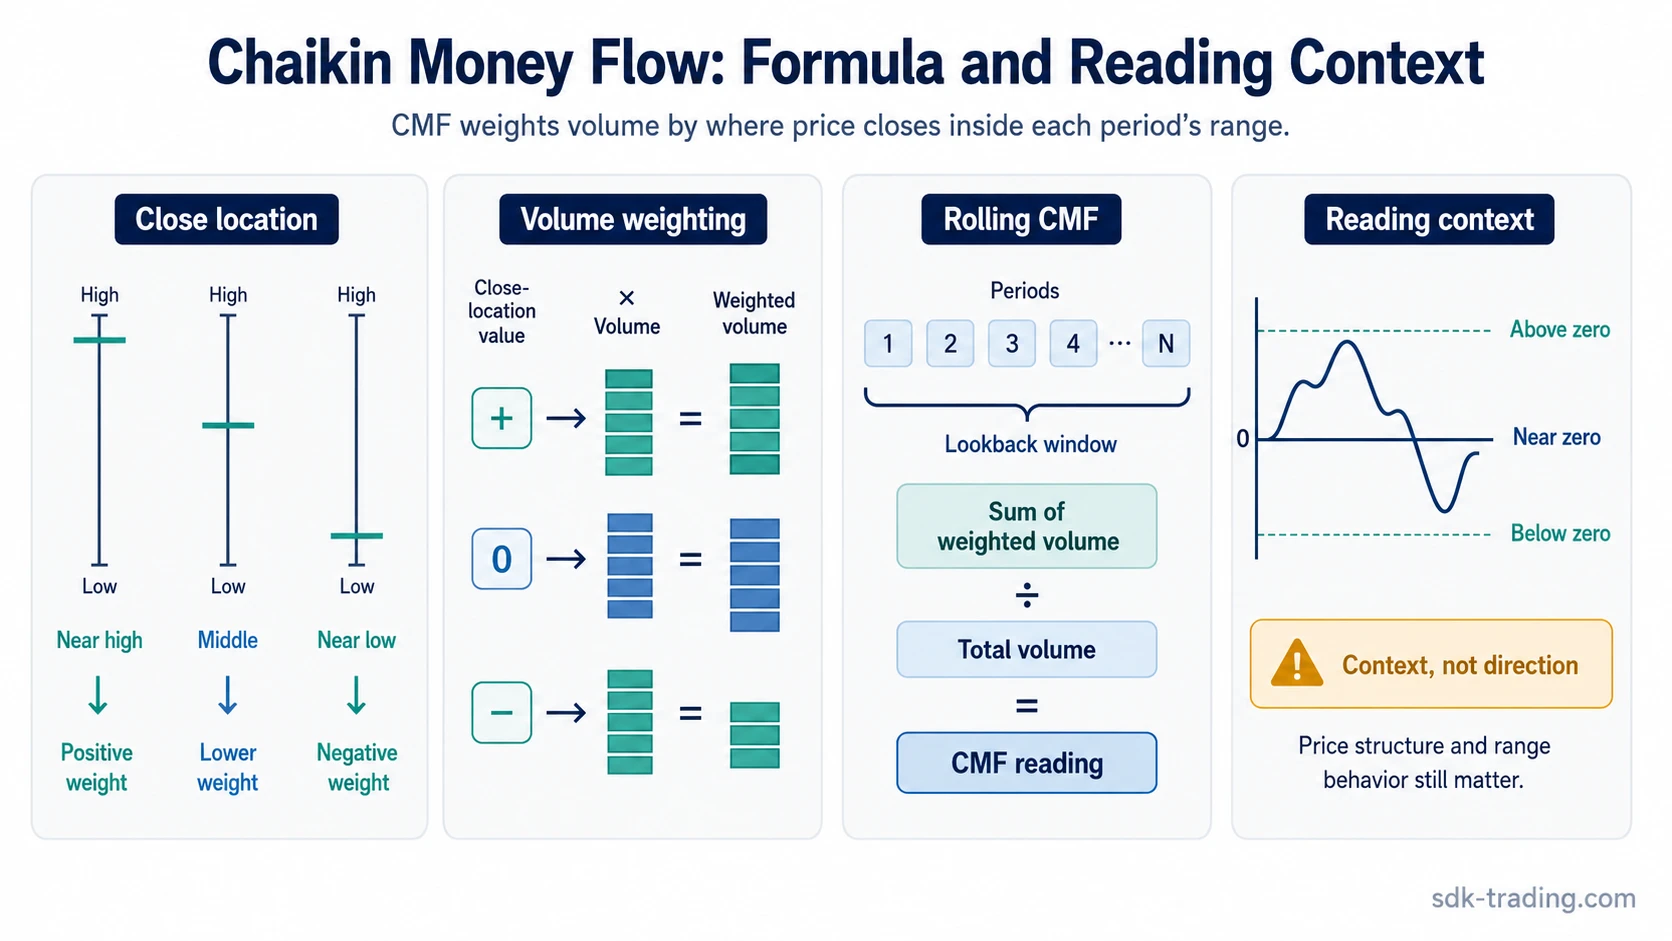
The idea is simple: a close near the high of the range gives that period’s volume a positive weight, while a close near the low gives it a negative weight. A close near the middle contributes less directional pressure because the period did not finish clearly near either boundary.
CMF is commonly viewed with a 20-period or 21-period lookback, though the exact default can vary by charting platform. A shorter lookback reacts more quickly but can flip more often. A longer lookback smooths more data, but it may respond more slowly when price and volume conditions change.
Reading note: CMF is best treated as a pressure and context reading. It can support an interpretation, but price structure, range behavior, and surrounding volume conditions still matter.
How the Chaikin Money Flow Formula Works
The CMF formula has three parts. First, it calculates where the close sits inside the high-low range. Second, it multiplies that close-location value by volume. Third, it compares the sum of that weighted volume with total volume over the selected lookback period.
| Step | Formula | What it means |
|---|---|---|
| Money Flow Multiplier | ((Close – Low) – (High – Close)) / (High – Low) | Shows whether the close is nearer the high, low, or middle of the period range. |
| Money Flow Volume | Money Flow Multiplier x Volume | Applies the close-location reading to that period’s volume. |
| Chaikin Money Flow | Sum of Money Flow Volume over N periods / Sum of Volume over N periods | Compares weighted volume with total volume over the lookback period. |
The Money Flow Multiplier is positive when the close is in the upper part of the range, negative when the close is in the lower part of the range, and closer to zero when the close is near the middle. The final CMF reading then compresses those weighted periods into one oscillator value.
Simple scenario: If price closes near the upper part of several ranges while volume remains elevated, CMF can move higher because more volume receives a positive weight. If the same price advance happens after a gap and then closes without meaningful follow-through, the CMF reading may look stronger than the broader price behavior supports.
How to Read Positive, Negative, and Zero-Line CMF Readings
CMF is usually read around the zero line. Positive readings show that, over the lookback window, more volume has been associated with closes toward the upper part of each range. Negative readings show that more volume has been associated with closes toward the lower part of each range.
| CMF reading | What it can suggest | Main caution |
|---|---|---|
| Above zero | More recent volume is weighted toward upper-range closes. | Positive CMF does not prove that price will continue higher. |
| Below zero | More recent volume is weighted toward lower-range closes. | Negative CMF does not prove that price will continue lower. |
| Near zero | Money-flow pressure is more balanced or unstable. | Small flips around zero can become noisy in sideways conditions. |
| Strong positive reading | Upper-range closes are dominating the weighted volume window. | A high reading can persist or fade; it is not a reversal clock. |
| Strong negative reading | Lower-range closes are dominating the weighted volume window. | A low reading can persist or fade; it is not a reversal clock. |
Thresholds can make CMF easier to scan, but they should not be treated as automatic triggers. A reading above or below zero is only one description of recent close-location pressure. The surrounding price structure decides whether that pressure is stable, fading, distorted, or still unresolved.
Clean, Weak, and Misleading CMF Readings
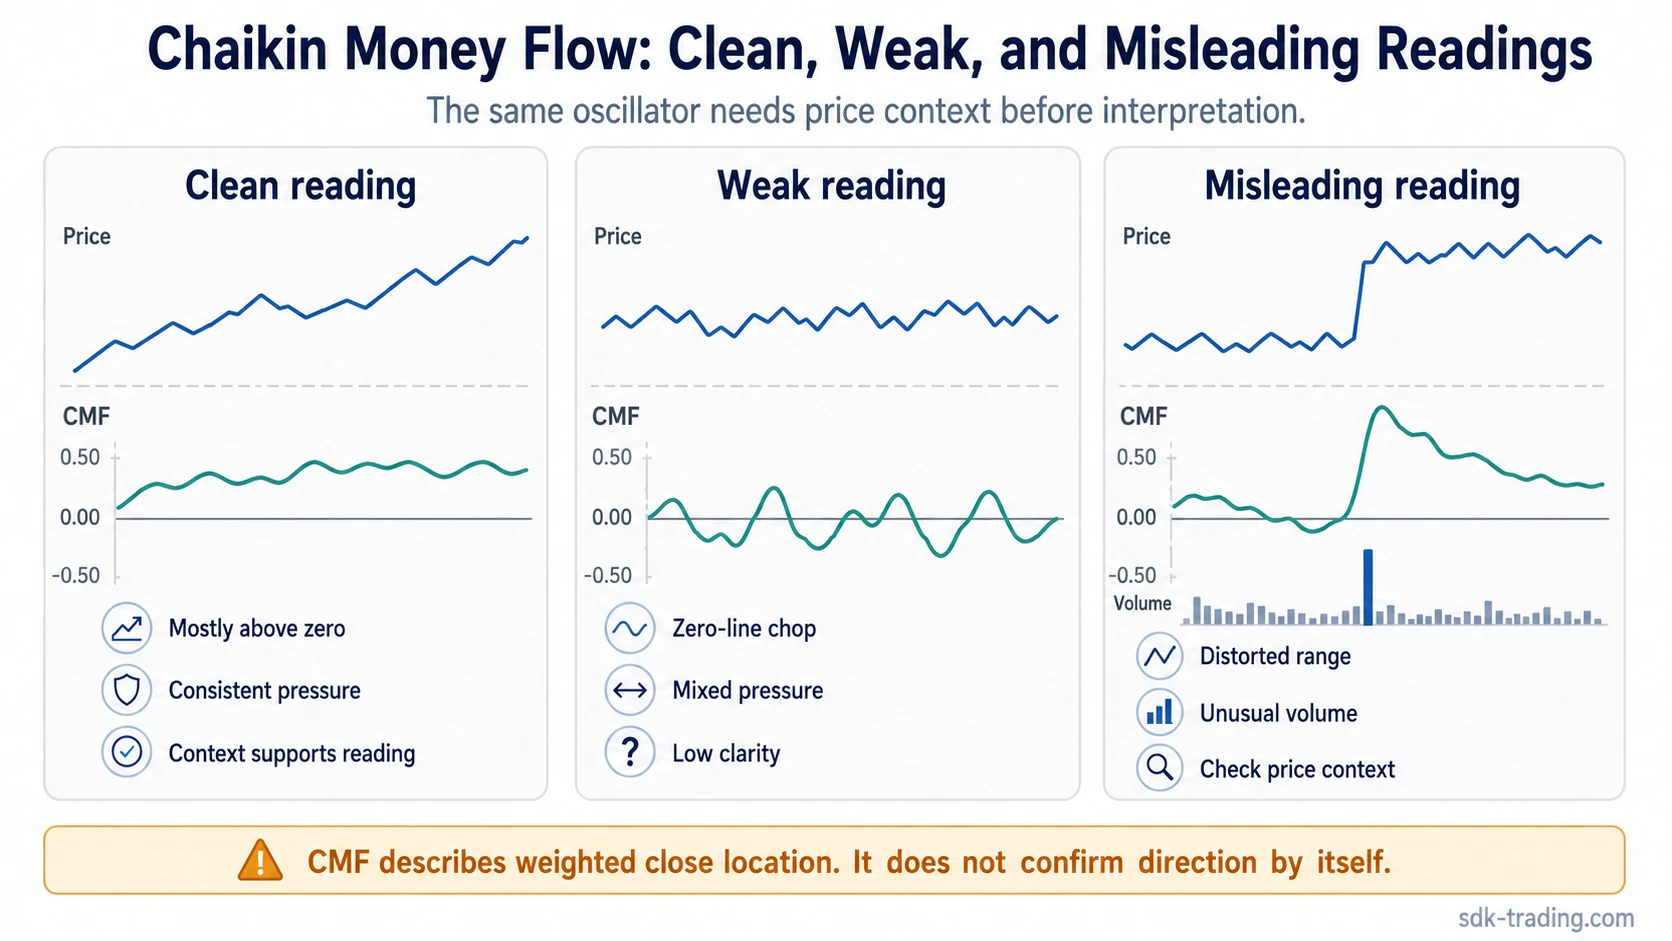
A clean CMF reading usually has two qualities: the close-location pressure is consistent across several periods, and the surrounding price behavior supports the same interpretation. A weak reading often appears when CMF flips around zero while price remains choppy or compressed.
| Reading type | What it looks like | Why it matters |
|---|---|---|
| Clean reading | CMF stays on one side of zero while price behavior supports the same pressure direction. | The indicator and price context are describing similar conditions. |
| Weak reading | CMF keeps flipping around zero while price remains range-bound or inconsistent. | The close-location signal may not be stable enough to interpret strongly. |
| Misleading reading | A gap, one unusual volume period, or a distorted range dominates the calculation. | The oscillator can overstate pressure when the underlying range behavior is not clean. |
One common problem is the gap disconnect. CMF uses the high, low, close, and volume of each period, but it does not fully explain how price traveled before that period formed. A strong close after a gap can create a high close-location reading even when follow-through is limited.
Limitation: CMF can describe where volume-weighted closes occurred. It cannot show the full intraperiod path, prove acceptance beyond a range, or separate clean pressure from a distorted range without price context.
Chaikin Money Flow vs Related Volume Indicators
Chaikin Money Flow belongs to the same broad price-volume family as several other volume indicators, but it does not measure the same thing as each one. The key distinction is that CMF normalizes close-location-weighted volume over a lookback window.
| Indicator | Main focus | Difference from CMF |
|---|---|---|
| Accumulation/Distribution Line | Cumulative close-location volume | CMF normalizes weighted volume over a lookback period instead of building a cumulative line. |
| Chaikin Oscillator | Momentum of the Accumulation/Distribution Line | CMF reads weighted volume pressure over a window; the oscillator compares moving averages of the A/D Line. |
| OBV | Cumulative volume direction | CMF uses close location inside the range; OBV mainly adds or subtracts volume based on price direction. |
| Force Index | Price change combined with volume | CMF focuses on close location inside each range, while Force Index focuses on the size and direction of price change with volume. |
| Volume Profile | Volume by price area | CMF works across time periods; Volume Profile organizes volume around price levels. |
The practical difference is that CMF is not simply “volume was high” or “price moved up.” It is a close-location reading. That distinction is why a CMF reading can disagree with another volume indicator without either one being automatically wrong.
Common Mistakes When Reading Chaikin Money Flow
The most common mistake is treating CMF as a standalone directional signal. A positive reading can support the idea that recent volume is associated with stronger closes, but it does not define the trend, confirm a breakout, or prove that a reversal is near.
Common misread: “CMF crossed above zero, so the market is bullish.” A safer interpretation is narrower: the recent lookback window has shifted toward more upper-range volume weighting. Price structure still decides whether that shift matters.
A second mistake is overreading a single threshold. A high CMF value may show strong pressure, but it can also remain elevated during an extended move or appear after a distorted gap. A low CMF value may show downside pressure, but it can also persist while price continues to trend or consolidate.
A third mistake is ignoring the range used by the formula. CMF can only weight volume based on the period’s high, low, and close. If the range is distorted, narrow, gap-driven, or part of a choppy sequence, the reading may not describe pressure as cleanly as it appears.
The more useful habit is to ask what CMF is actually describing: where closes have occurred inside recent ranges, how much volume was attached to those closes, and whether the surrounding price behavior supports or weakens that pressure reading.
Chaikin Money Flow Reliability
Chaikin Money Flow is most useful when the reading aligns with stable price behavior and meaningful volume participation. It becomes less reliable when gaps, one unusual session, thin ranges, or repeated zero-line flips dominate the calculation.
The cleaner question is narrow: are recent closes tending to occur near the upper or lower part of the range while volume participates? If that question is stretched into a full prediction about continuation, reversal, or setup quality, the CMF reading is being asked to do more than it measures.
Context rule: CMF can help describe pressure, but it should not replace price structure, range acceptance, or broader confirmation work.
FAQ
What does Chaikin Money Flow measure?
Chaikin Money Flow measures volume-weighted close location over a selected lookback period. It gives positive weight to volume when price closes near the upper part of the range and negative weight when price closes near the lower part of the range.
What is the Chaikin Money Flow formula?
The formula calculates a Money Flow Multiplier from high, low, and close, multiplies that value by volume, then divides the sum of Money Flow Volume by total volume over the lookback period.
Is Chaikin Money Flow the same as the Accumulation/Distribution Line?
No. Both use close location inside the high-low range, but the Accumulation/Distribution Line is cumulative, while Chaikin Money Flow normalizes weighted volume over a lookback period.
What is the difference between Chaikin Money Flow and the Chaikin Oscillator?
Chaikin Money Flow measures weighted volume pressure over a lookback window. The Chaikin Oscillator measures momentum in the Accumulation/Distribution Line by comparing moving averages of that line.
Can Chaikin Money Flow give false signals?
Yes. CMF can mislead when gaps, choppy ranges, unusual volume, or repeated zero-line flips make the close-location reading look stronger than the broader price context supports.