Accumulation Distribution is a cumulative price-volume line that weights volume by where the close occurs inside the current high-low range. Its useful reading comes from repeated weighted contributions over time, not from one isolated movement. The line describes accumulation or distribution pressure as calculated by the indicator, not trade validity or future price direction.
Key Points
- Accumulation Distribution, often called the A/D line or ADL, adds close-location-weighted volume from each period into a running total.
- The calculation starts with close location: closes near the high add positive weighted volume, closes near the low add negative weighted volume, and closes near the middle reduce the contribution.
- Divergence between price and the A/D line is an observation about mismatch, not proof that price must reverse.
- Gaps, thin liquidity, abnormal volume, and one-bar distortions can make the reading weaker than the line first appears.
What Accumulation Distribution Measures
Accumulation Distribution measures how much volume is being added to or subtracted from a cumulative line based on the close’s position inside each period’s range. If a candle or bar closes near its high, the formula treats more of that period’s volume as positive money flow. If it closes near its low, the formula treats more of that volume as negative money flow.
The mechanism is different from looking at volume alone. High volume does not automatically lift the A/D line. The line rises only when that volume is paired with a close position that produces a positive money flow multiplier. It falls when volume is paired with a negative close-location reading.
Working definition: Accumulation Distribution is a cumulative volume indicator that translates each period’s close location into a volume-weighted contribution, then adds that contribution to the prior A/D value.
The word “accumulation” in the indicator name does not prove that large buyers are building positions. The word “distribution” does not prove that large sellers are exiting. The line is a calculated approximation of pressure using high, low, close, and volume data.
How the Accumulation Distribution Formula Works
The A/D formula has a sequence. First it calculates where the close sits inside the period’s range. Then it converts that close location into a money flow multiplier. Then it multiplies that value by volume. The result is added to the previous A/D value.
| Step | Formula or action | What it means |
|---|---|---|
| 1. Money flow multiplier | ((Close – Low) – (High – Close)) / (High – Low) | Measures whether the close is closer to the high, low, or middle of the period’s range. |
| 2. Money flow volume | Money flow multiplier x Volume | Weights that period’s volume by the close-location result. |
| 3. A/D line | Previous A/D value + Money flow volume | Adds the current period’s weighted volume to the cumulative line. |
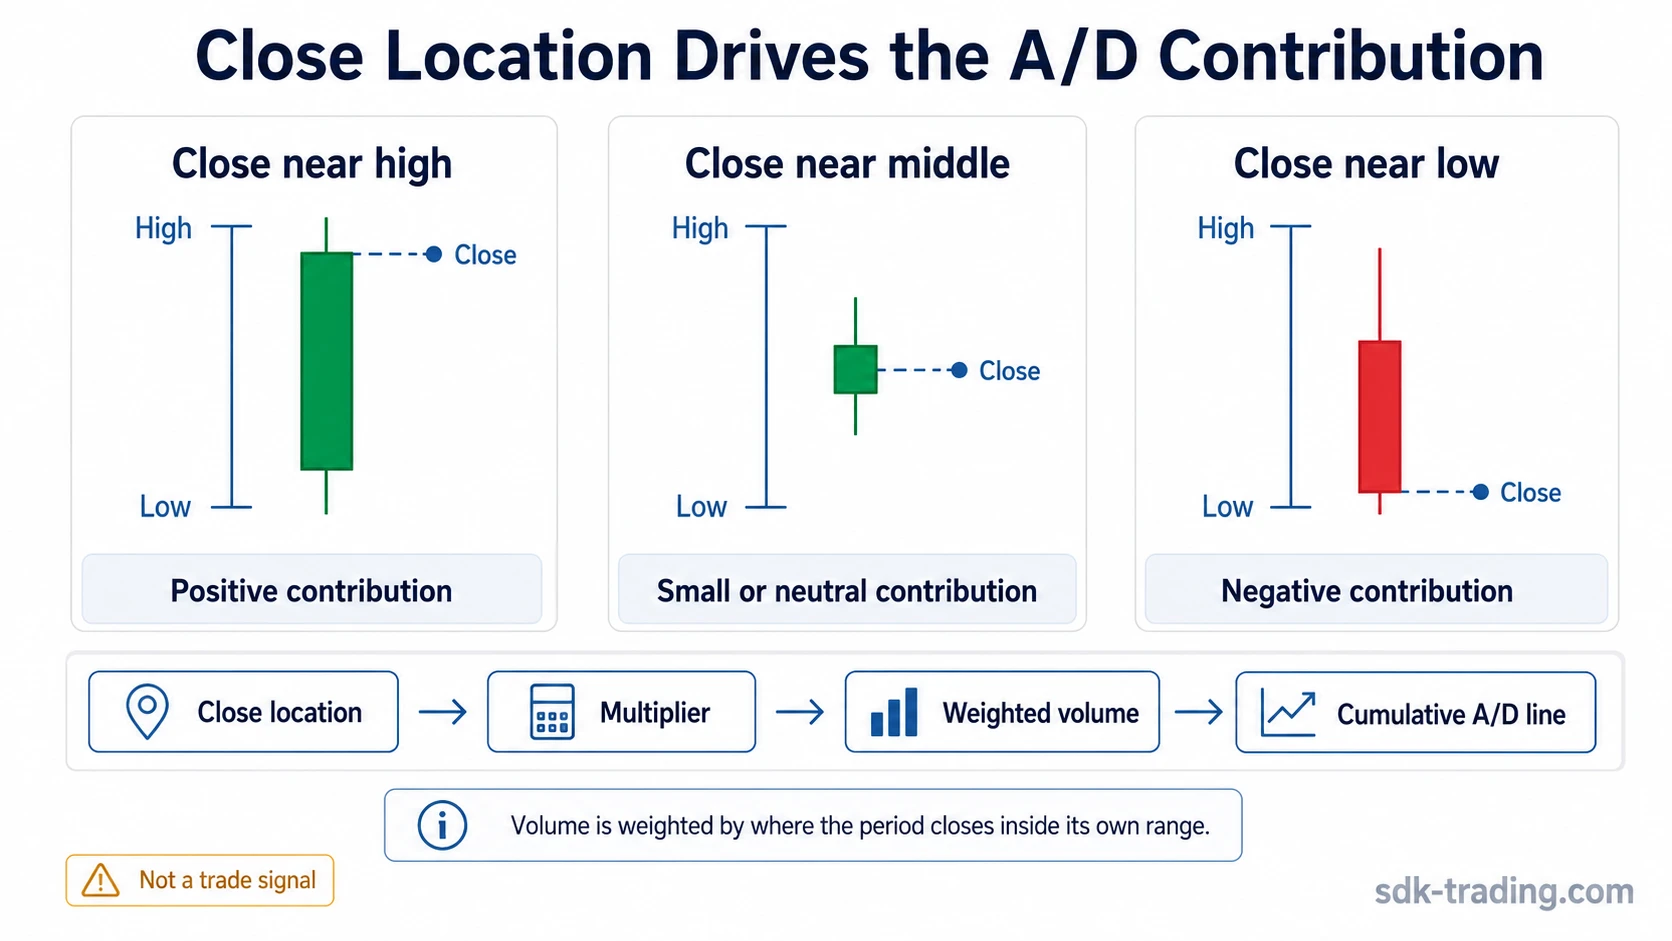
A close near the high produces a positive multiplier. A close near the low produces a negative multiplier. A close near the midpoint produces a smaller contribution because the formula sees less directional pressure inside that period’s range.
If the high and low are identical, the standard formula cannot be calculated in the usual way because the denominator is zero. That edge case is rare in actively traded markets, but it is one reason sparse or flat-range data should be treated carefully.
How to Read the A/D Line
The A/D line is usually read through its slope, persistence, and relationship to price. A rising line means positive money flow volume has been added repeatedly. A falling line means negative money flow volume has dominated the cumulative calculation. A flat or choppy line means recent positive and negative contributions are offsetting each other.
| A/D line behavior | Formula mechanism | Safer reading |
|---|---|---|
| Rising A/D line | Volume is repeatedly paired with closes closer to the high of the range. | The indicator is adding positive close-location-weighted volume across multiple periods. |
| Falling A/D line | Volume is repeatedly paired with closes closer to the low of the range. | The indicator is adding negative close-location-weighted volume across multiple periods. |
| Flat A/D line | Positive and negative money flow volume are offsetting each other. | The indicator is not showing a persistent pressure imbalance. |
| Price rises while A/D lags | Price advances are not being matched by strong positive close-location volume. | The price move is not being matched by the same close-location-weighted volume contribution inside the indicator. |
| Price falls while A/D firms | Downward price movement is not being matched by persistent negative money flow volume. | The decline has weaker negative pressure inside the indicator. |
Divergence is the most common interpretive use. If price makes a higher high while the A/D line fails to confirm that move, the mismatch can show weaker close-location-weighted volume behind the advance. If price makes a lower low while the A/D line holds firmer, the mismatch can show less negative pressure inside the calculation.
The important boundary is persistence. One divergence point is weaker than a repeated pattern of mismatched price and money flow volume. The A/D line is more useful when its cumulative behavior agrees with broader price structure than when a single bar is treated as proof.
When the Reading Is Stronger or Weaker
The A/D line becomes more readable when the same pressure pattern appears across several periods. It becomes weaker when one unusual bar, distorted volume print, or thin-market condition dominates the cumulative calculation.
| Condition | What it suggests | What can weaken it |
|---|---|---|
| Repeated closes near the high with meaningful volume | Positive money flow volume is being added consistently. | The reading weakens if the behavior comes from one isolated spike rather than repeated periods. |
| Price rising while A/D lags | The advance may have weaker close-location-weighted volume support. | The mismatch is less useful if the A/D line is distorted by a prior gap or abnormal volume bar. |
| Price falling while A/D firms | Negative pressure may be fading inside the indicator calculation. | The reading can fail if price continues lower while closes remain weak in later periods. |
| One isolated A/D jump | A single bar produced a large positive money flow volume contribution. | One jump does not establish a durable accumulation pattern. |
| Abnormal volume | The cumulative line can move sharply because the multiplier is applied to unusually large volume. | News, rebalancing, data errors, or one-off events can distort the reading. |
| Low liquidity | Small trades may move the close within the range and affect the multiplier. | The close-location reading can be easier to distort when participation is thin. |
A stronger A/D reading usually depends on repetition and consistency. The indicator becomes less reliable when the interpretation depends on one bar that carries unusual volume or an unusual close position.
Where Accumulation Distribution Can Mislead
Accumulation Distribution can mislead because the standard formula does not directly compare the current close with the previous close. It reads the current period’s high, low, close, and volume. That makes gaps especially important.
For example, price can gap lower from the previous session, trade in a lower range, and then close near the high of that new range. The A/D formula can produce a positive contribution because the close was strong inside the current period’s range. That does not erase the information contained in the gap lower. The formula is reading close location within the current range, not the full path from the previous session.
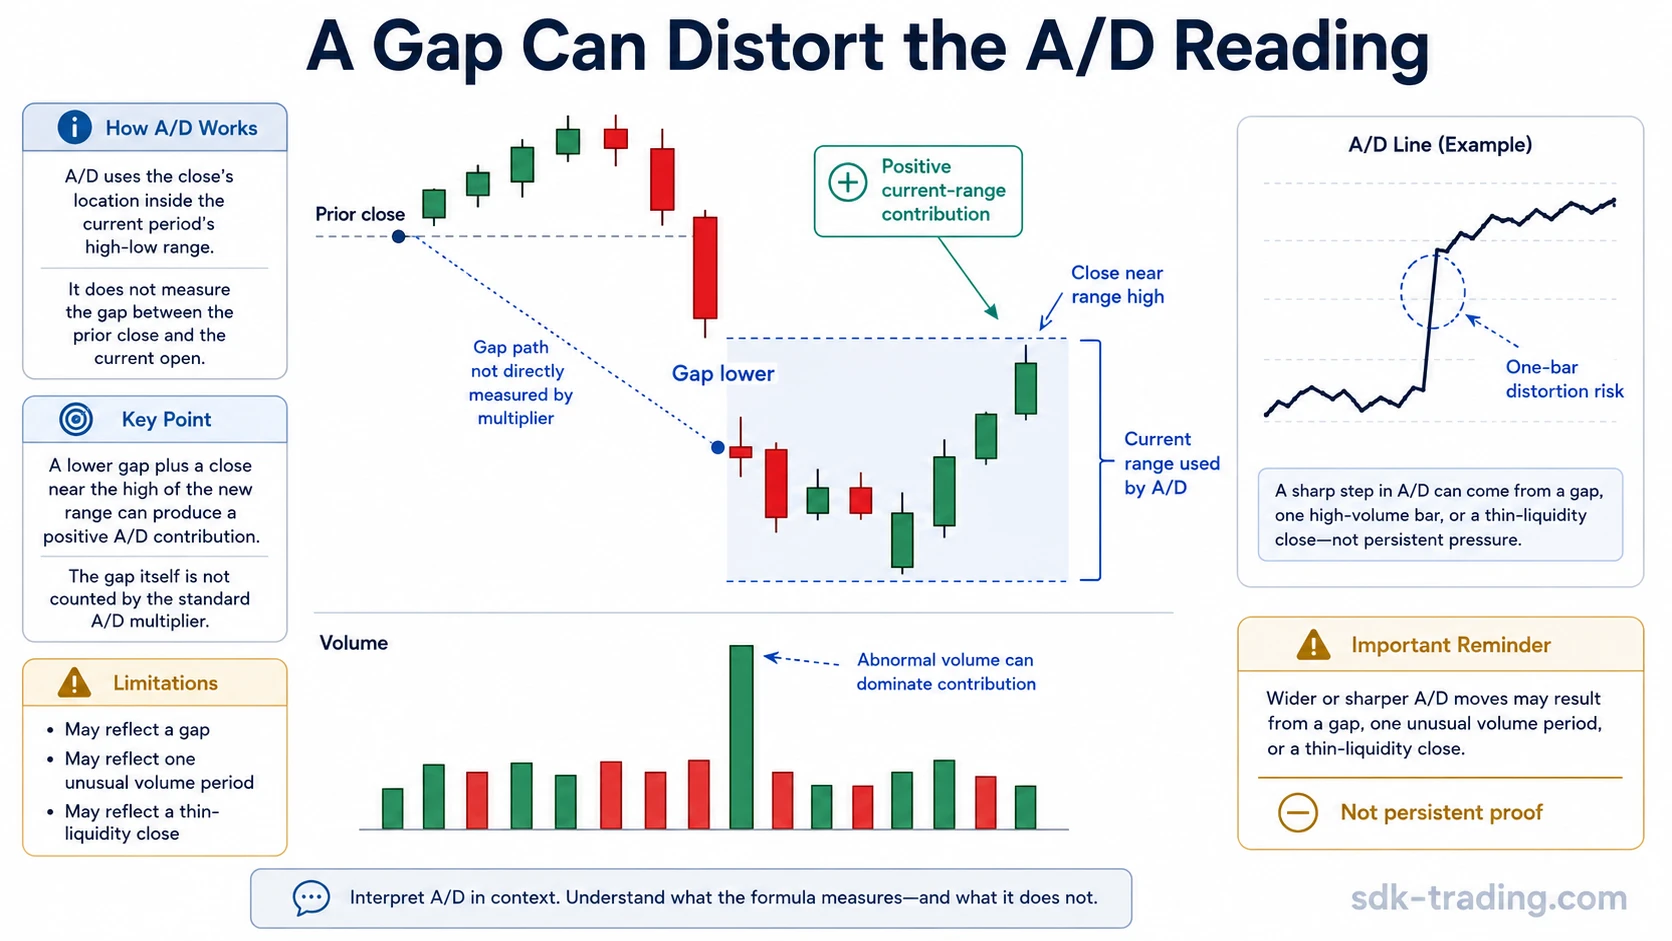
Distorted volume is another problem. If one bar carries unusually large volume because of an event, index rebalance, block trade, or data irregularity, the A/D line can shift sharply even though the broader sequence has not changed. Thin markets can create the same issue because the close location may be easier to distort.
Close-Location Boundary: The A/D line is strongest as a cumulative pressure reading. It is weaker when the interpretation depends on one bar, one gap, one abnormal volume event, or one thin-liquidity close.
Accumulation Distribution vs Related Volume Indicators
Accumulation Distribution belongs to the price-volume indicator family, but its calculation is specific. It should not be blended with every volume tool that also uses price and volume.
| Indicator or concept | Main calculation idea | Key difference from Accumulation Distribution |
|---|---|---|
| OBV | Adds or subtracts full volume based on whether the close is higher or lower than the prior close. | OBV uses close-to-close direction. A/D uses where the close sits inside the current high-low range. |
| Chaikin Money Flow | Uses close-location money flow over a rolling window. | CMF is usually read as a bounded or rolling pressure measure, while A/D is cumulative. |
| Force Index | Combines price change and volume. | Force Index emphasizes price change multiplied by volume, not close location inside each period’s range. |
| Volume Profile | Shows how volume is distributed across price levels. | Volume Profile is price-level based. A/D is a time-series cumulative line. |
| Broad volume indicators | Measure activity, momentum, participation, or pressure in different ways. | A/D should be read through its own formula, not as a generic volume confirmation tool. |
The cleanest distinction is the first calculation step. If the indicator begins by asking where the close sits inside the current range, it is closer to A/D logic. If it begins with close-to-close direction, price-level volume distribution, or price change multiplied by volume, it is measuring a different volume relationship.
Common Mistakes When Reading Accumulation Distribution
A common mistake is treating every rise in the A/D line as bullish proof. The line can rise because several periods closed near their highs, but price may still be under resistance, inside a weak structure, or reacting after a gap. The indicator gives one close-location-weighted pressure reading, not a complete view of market structure.
Another mistake is using divergence as a reversal claim. Divergence says that price and cumulative money flow volume are not aligned. It does not say when price must change direction, how far it may move, or whether a trend has ended.
A third mistake is comparing A/D values across unrelated instruments without accounting for volume scale. Since A/D is cumulative and volume-based, its raw value depends on the instrument’s volume history. The shape and behavior of the line usually matter more than the absolute number.
The most useful reading comes from sequence: repeated close-location behavior, volume quality, price response, and whether later bars continue or reject the same pressure pattern.
FAQ
What does Accumulation Distribution show?
Accumulation Distribution shows a cumulative volume-weighted pressure line based on where each period closes inside its high-low range. Closes near the high add positive money flow volume, while closes near the low add negative money flow volume.
Is the A/D line the same as OBV?
No. OBV adds or subtracts volume based on whether the close is above or below the previous close. The A/D line weights volume by the close’s position inside the current period’s high-low range.
Why can gaps mislead the Accumulation Distribution line?
Gaps can mislead because the A/D formula focuses on the current period’s high, low, close, and volume. A bar can close near the high of its own range after a gap lower, producing a positive contribution even though the gap itself was negative.
What is A/D divergence?
A/D divergence is a mismatch between price behavior and the cumulative A/D line. It can show that price movement is not being matched by the same close-location-weighted volume pressure, but it does not prove a reversal.